IoT / M2M

RF port impedance verification

Well-matched RF ports are a crucial aspect to any RF system. Matched ports, for example, protect amplifier output ports from reflected power overload. This undesired reflected power could destroy the whole amplifier. Matched ports also maximize power transmission, effectively extending the battery life of wireless products such as those made for the internet of things (IoT).

Your task

In the RF world, there are two standard values for the characteristic impedance of single-ended components:

50 Ω and 75 Ω. Most cables, connectors and RF components are matched to one of these two values. 75 Ω is a value frequently found in (cable) TV applications since this is close to 77 Ω, which is the point of minimum RF attenuation. 50 Ω is a compromise between high power transmission capability (30 Ω) and low attenuation. It is, however, important to have all components matched to the same impedance value.

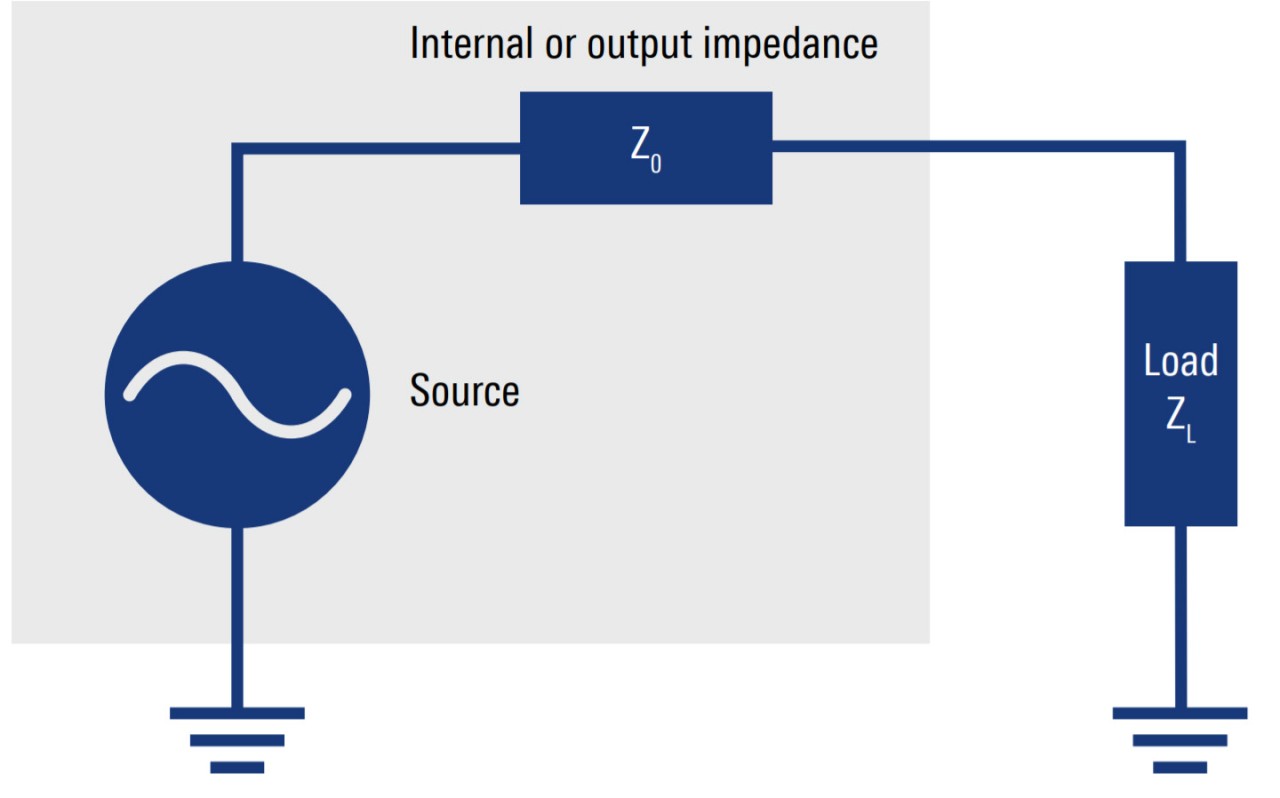
Impedance matching (ZL = Z0)
Impedance matching
Open Lightbox

Achieving maximum power transmission

According to the power transfer theorem, the key component to achieving maximum power transfer is to match the source impedance Z0 and load impedance ZL. In the matching case, ZL equals Z0.

Reducing RF power reflection

The effect of port matching can be expressed in three different parameters:

1. Reflection coefficient

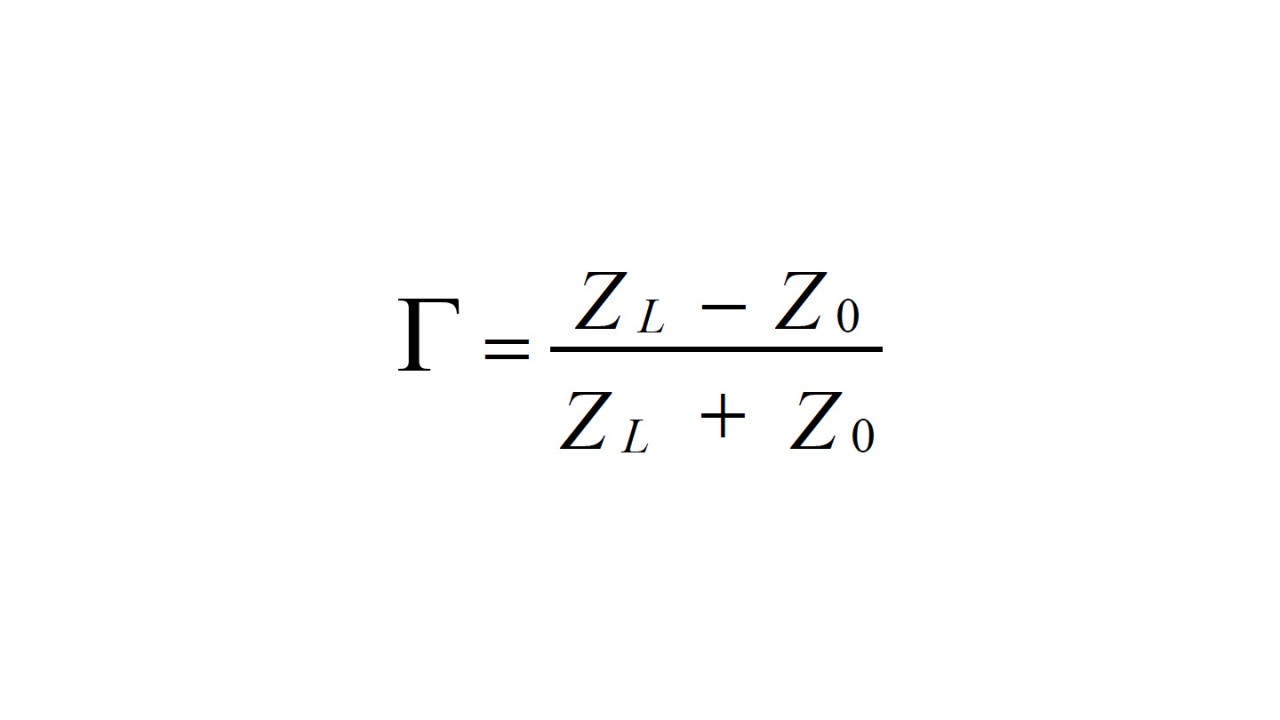
The percentage of the reflected wave compared to the incident wave is designated by Γ:

Reflection coefficient

A perfect match between source and load corresponds to Γ = 0, full reflection corresponds to |Γ| = 1.

2. Voltage standing wave ratio (VSWR)

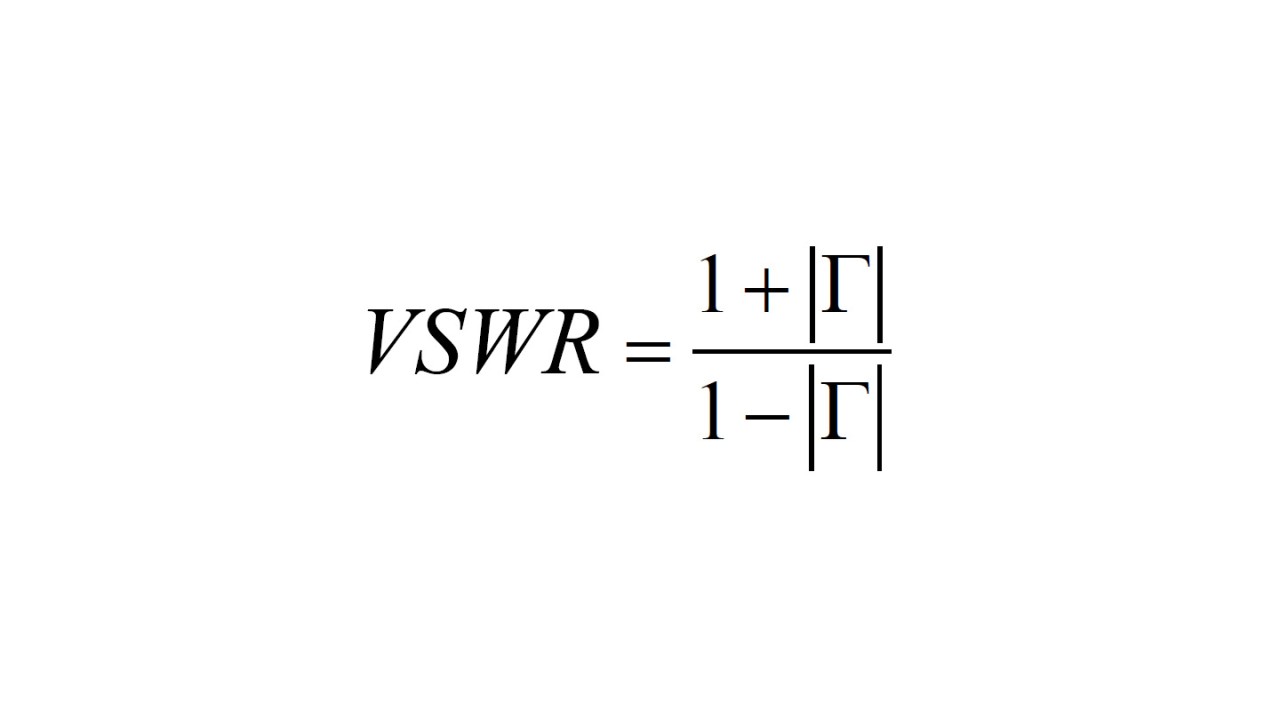
Alternatively, reflection can be looked at from a voltage standing wave ratio (VSWR) point of view:

Voltage standing wave ratio (VSWR)

VSWR is a measure of how efficiently power is transmitted. VSWR = 1 indicates optimum power transmission without reflection, higher values indicate room for impedance matching improvements. More reflected power means less transmitted power, which leads to unnecessary battery power consumption. It can also damage your signal source.

3. Return loss

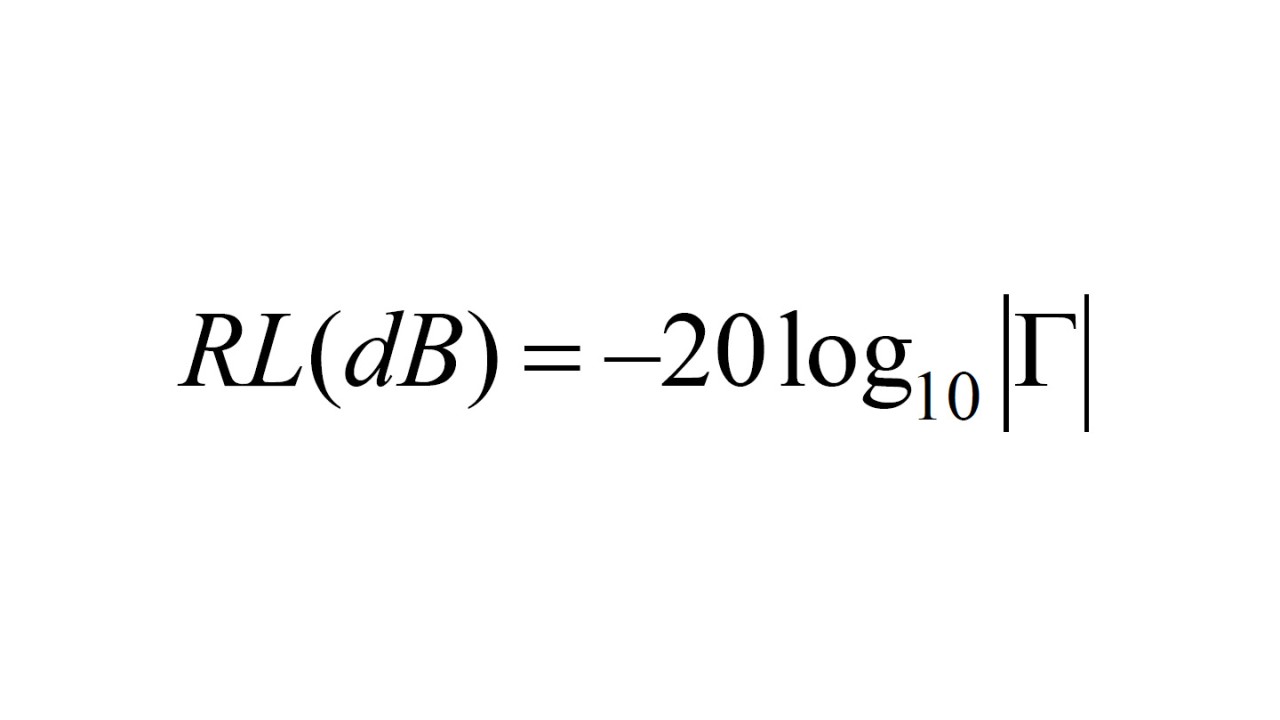
Reflection can also be expressed in return loss:

Return loss
Reactance circles
Reactance circles
Open Lightbox

It is a measure of how well ports are matched. High return loss is desirable. It is the preferred representation over VSWR due to better resolution of good matching characteristics.

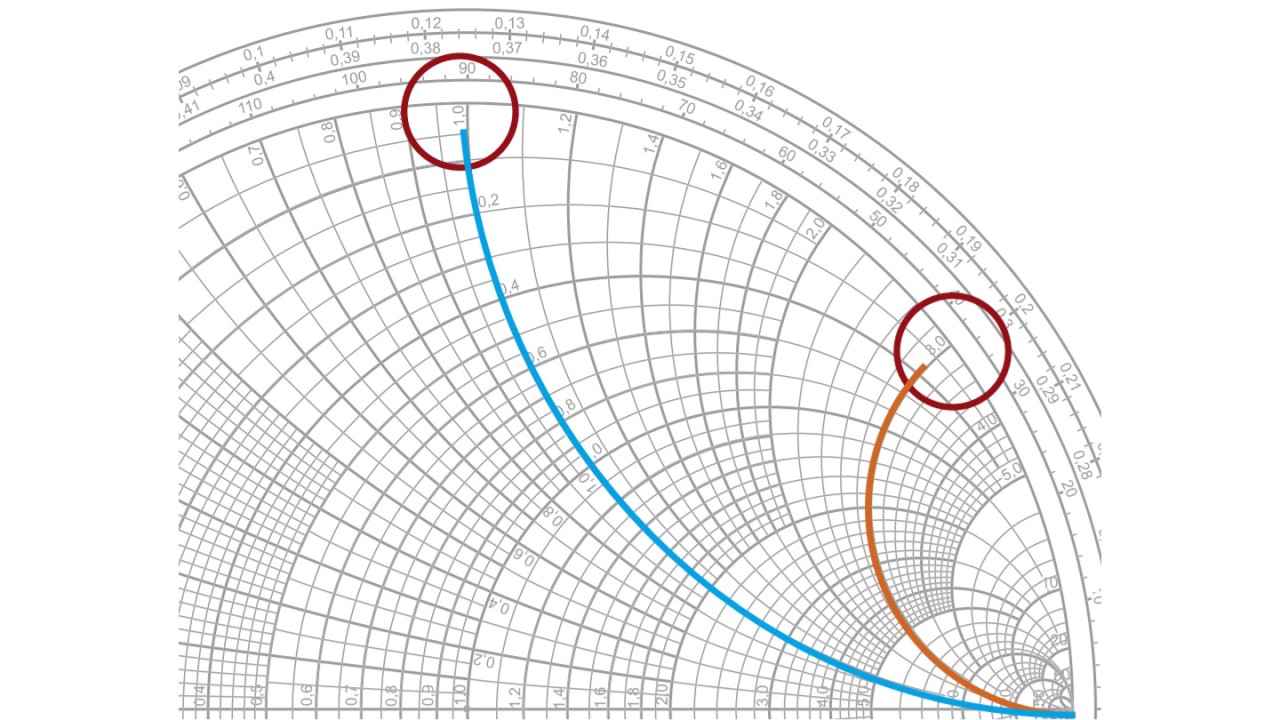
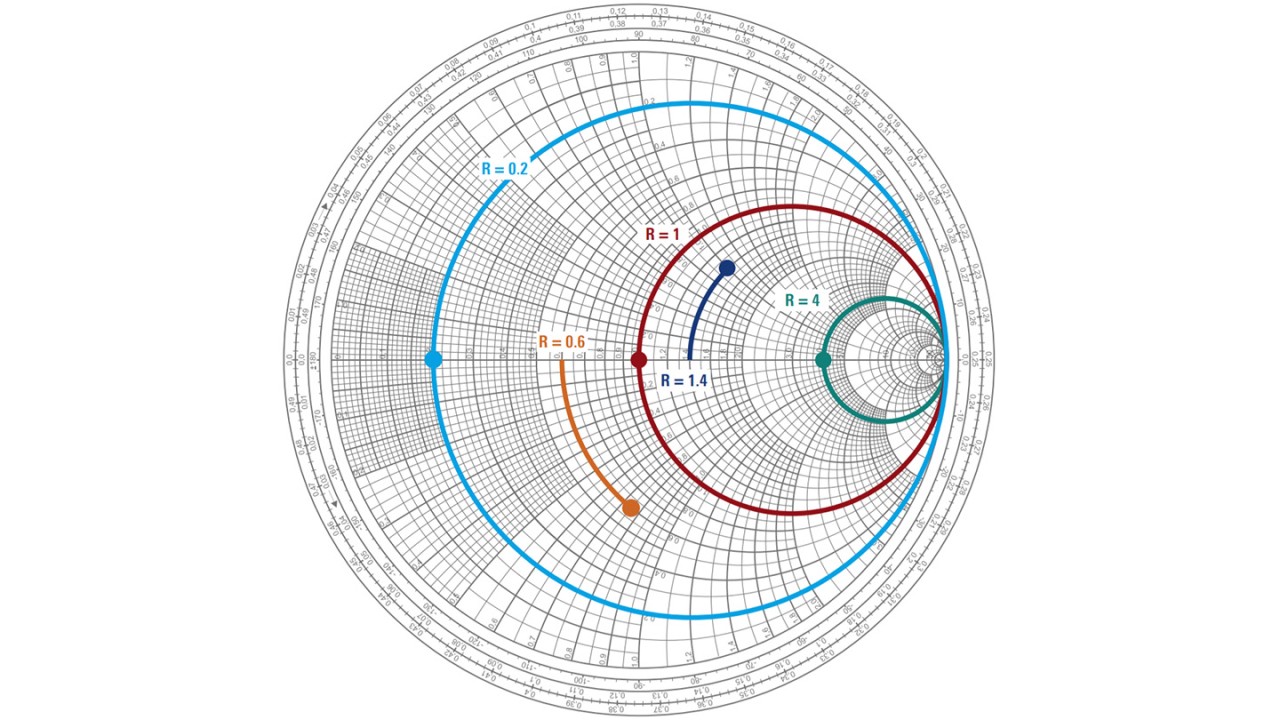
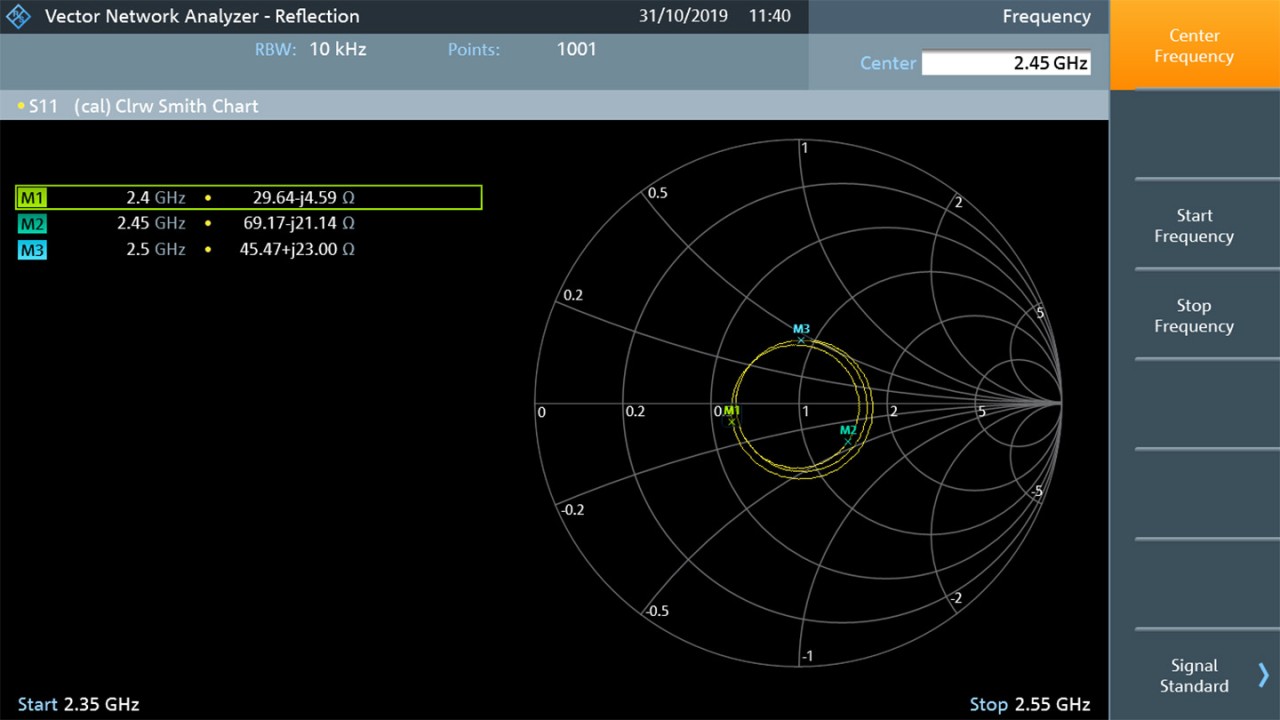
You can visualize the measurement of a load matching with the Smith chart. This is an excellent, proven tool for viewing matching characteristics. It graphically displays the impedance of the resistive (resistance circles) and the reactive (reactance circles) portion, with the top half being of inductive and the bottom half of capacitive nature. Each point on the chart identifies the impedance associated with a certain frequency. Those values are represented by the complex number Z = R ± jX. Its resistive part is indicated by the real term R and its reactive part by the imaginary term.

Resistance circles
Resistance circles
Open Lightbox

For a traditional Smith chart, the resistance rises from 0 (leftmost side of the chart) to infinite (rightmost side of the chart). The upper half of the chart shows positive values of jX, thus designating an inductive behavior of the impedance, while in the lower half of the chart those values are negative and the behavior is capacitive. Please be aware that the Smith chart is normalized to the reference impedance (50 Ω or 75 Ω) depending on the equipment used.

Rohde & Schwarz solution

A simple way to achieve good impedance characteristics is by selecting proper components and verifying by measurement. This measurement is easiest done using a vector network analyzer (VNA) with a Smith chart display. The R&S®FPC1500 offers three times the value. It is not only a great, economical spectrum analyzer with an independent signal source. It is also a one-port vector network analyzer with integrated VSWR bridge. And the integrated Smith chart display and marker functions automatically convert normalized impedance to Ohms based on the selected impedance system.

Calibration at the measurement plane, i.e. the interface between the coupling network location and the network analyzer cables, is an extremely important step in order to compensate for the effects of cables and connectors. Manual calibration is error prone and time-consuming when the open-short-load standards are toggled manually. The R&S®ZN-Z103 calibration unit automates toggling the standards. This helps reduce connection error and reduces the calibration time to a few seconds.

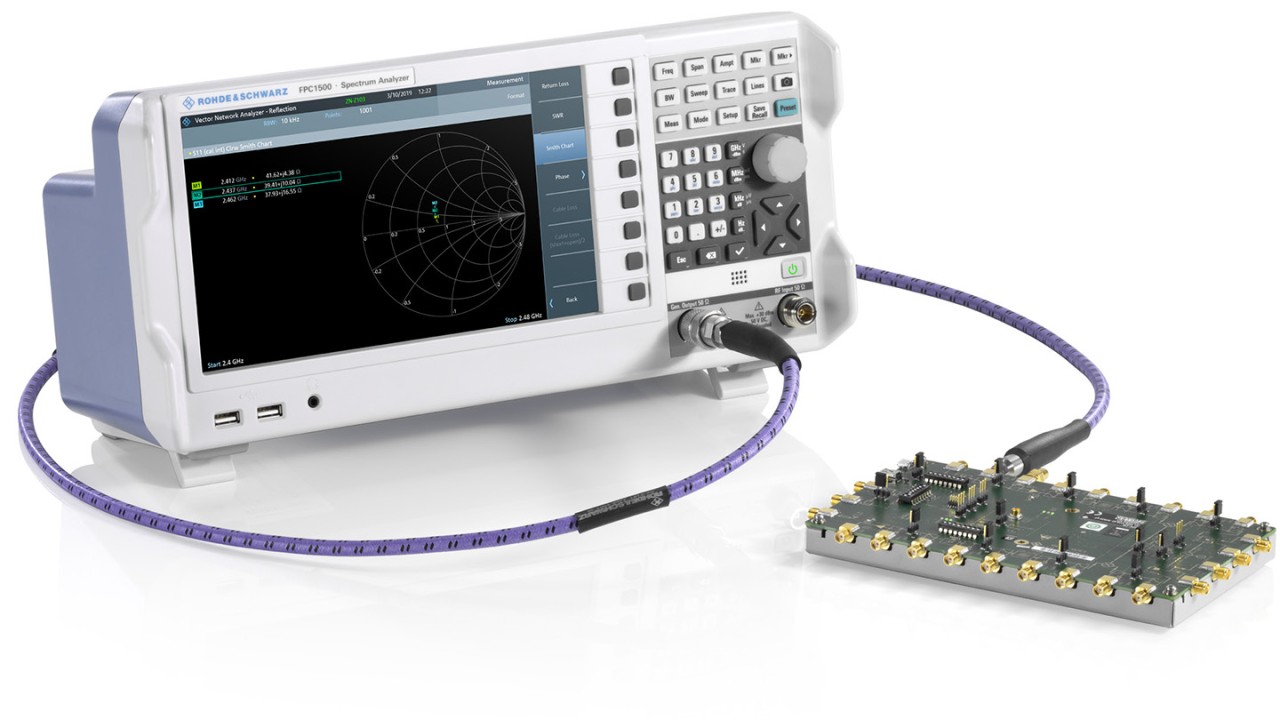
First, set the measurement conditions (desired frequency range, resolution bandwidth and number of measurement points). Then connect the R&S®ZN-Z103 to the USB port of the R&S®FPC1500. The instrument automatically recognizes the calibration unit. Next, connect one end of the coaxial cable to the output port of the R&S®FPC1500 and the other end to the calibration unit. Press “Calibrate → Full 1-port“. The instrument is now calibrated and ready to examine the DUT.

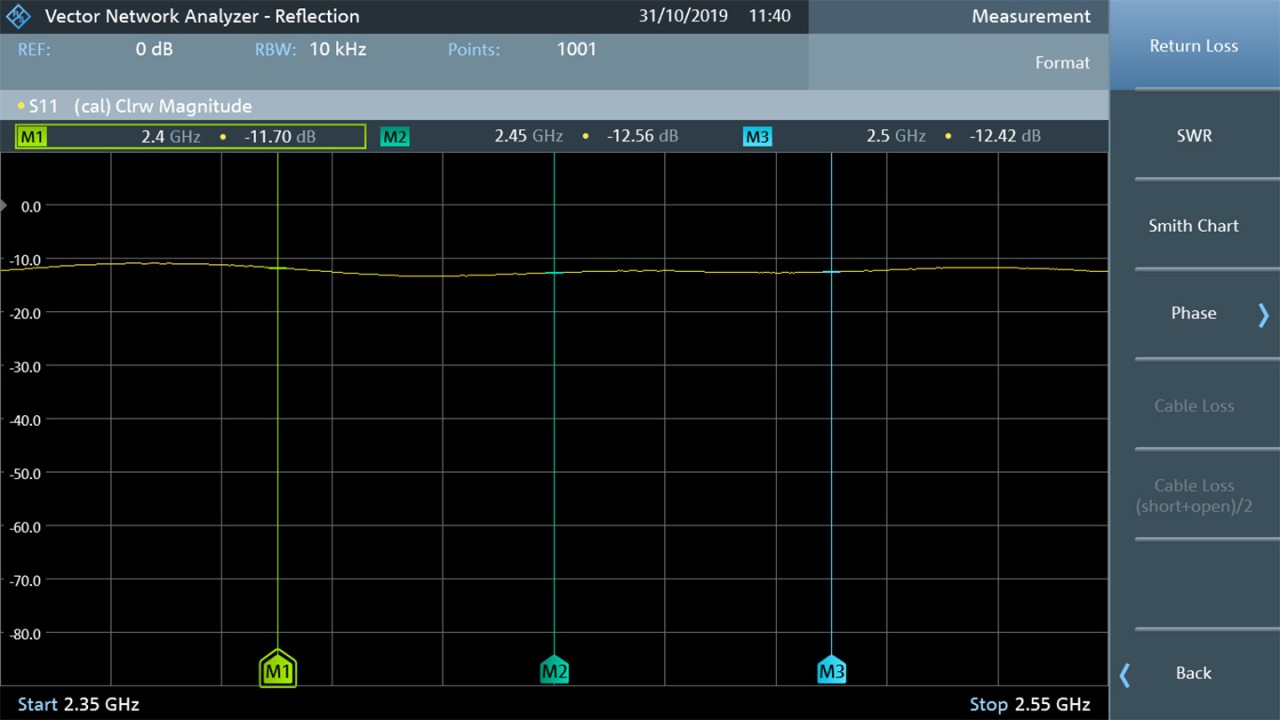
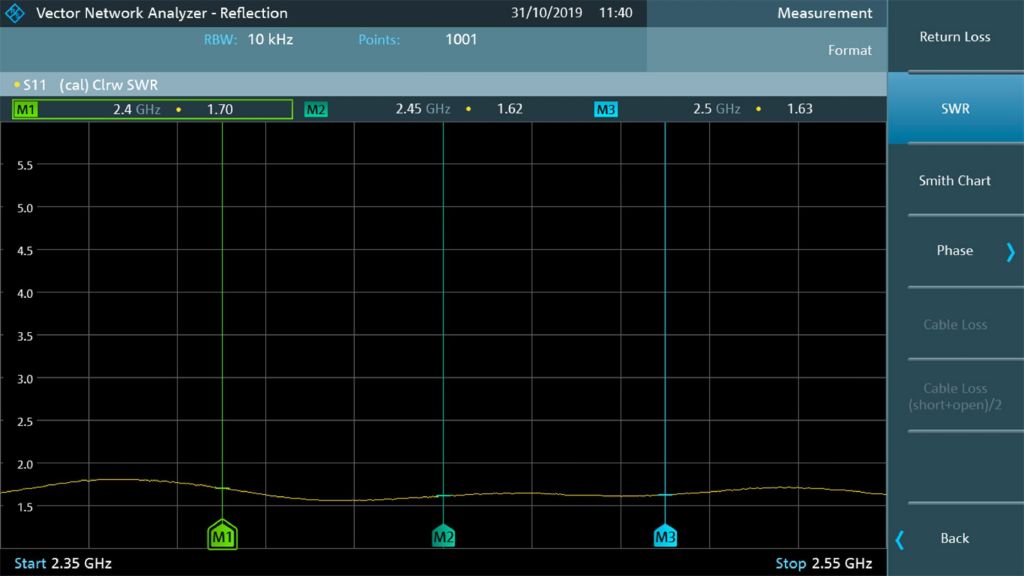
Below are screenshots showing result examples in VSWR, return loss and a Smith chart within the 2.4 GHz ISM band:

result examples in VSWR
While a VSWR = 1 is not achievable in reality, a value of approx. 1.6 is acceptable. As a rule of thumb, the VSWR should be < 1.5.
Result examples in VSWR
By manual calculation or the simple press of a button, the return loss is approx. 12 dB.
Impedance revealed in a Smith chart
FPC1500 measuring port on RF device
R&S®FPC1500 measuring port on RF device
Open Lightbox

Summary

Verifying RF ports is a key component for minimizing lost or reflected power and maximizing battery life. It also prevents components from overheating or being permanently damaged. R&S®FPC1500 is a great, easy-to-use and costeffective tool for this type of verification.

Related solutions