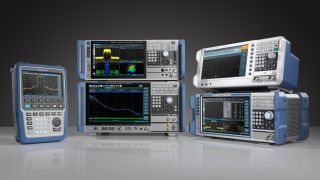
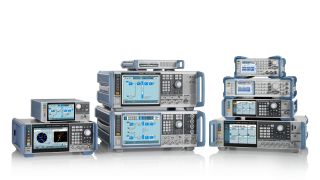
R&S test and measurement product portfolio
Test & measurement instruments and systems – from the audio to the millimeter wave range
Rohde & Schwarz is one of the world's largest manufacturers of electronic test and measurement equipment. Our products set standards in research, development, production and service. As a key partner of industry and network operators, we offer a broad spectrum of market-leading solutions for the newest wireless technologies as well as for RF and microwave applications up to 500 GHz.


