Testing a 24-28GHz Power Amplifier using the 5G New Radio Test Standard, Challenges and Results

An ever-increasing requirement for data on mobile networks, driven by a myriad of applications from HD video on the move to autonomous vehicles and Industrial IOT, means a part of the new 5G network is to be deployed at mmWave frequencies, with a 26 GHz pioneer band defined for the UK between 24.25 - 27.5 GHz.

This near 10-fold increase in frequency over 4G networks opens several challenges, both in the design and implementation of the required sub-components, network infrastructure and end user equipment, and in parallel in the test and measurement approaches used to drive these developments.

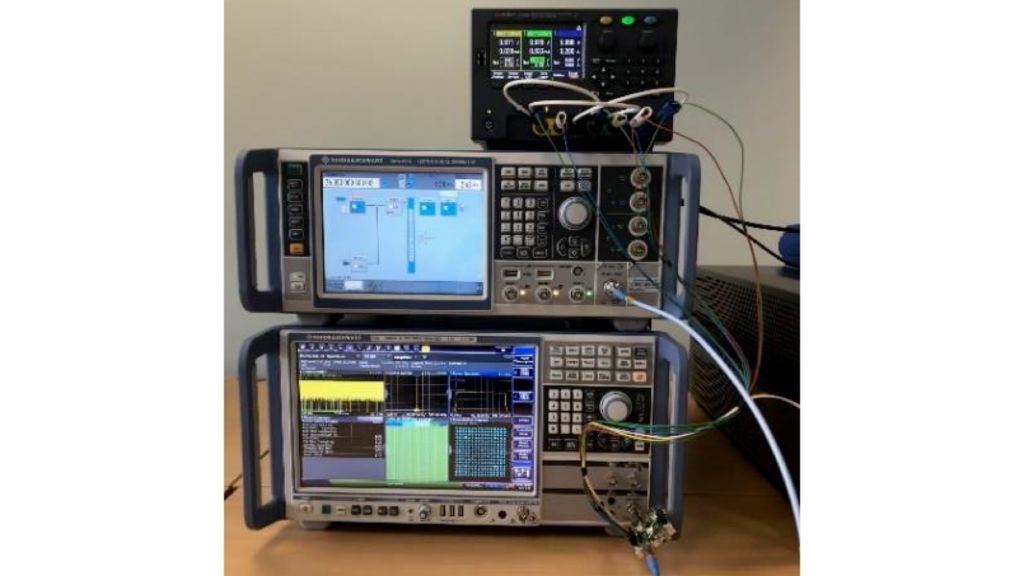
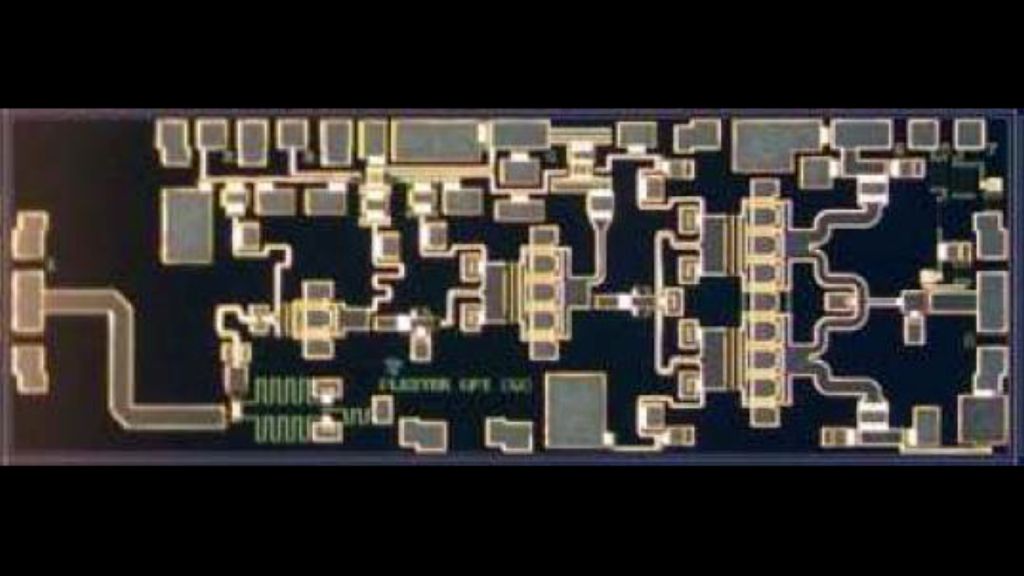
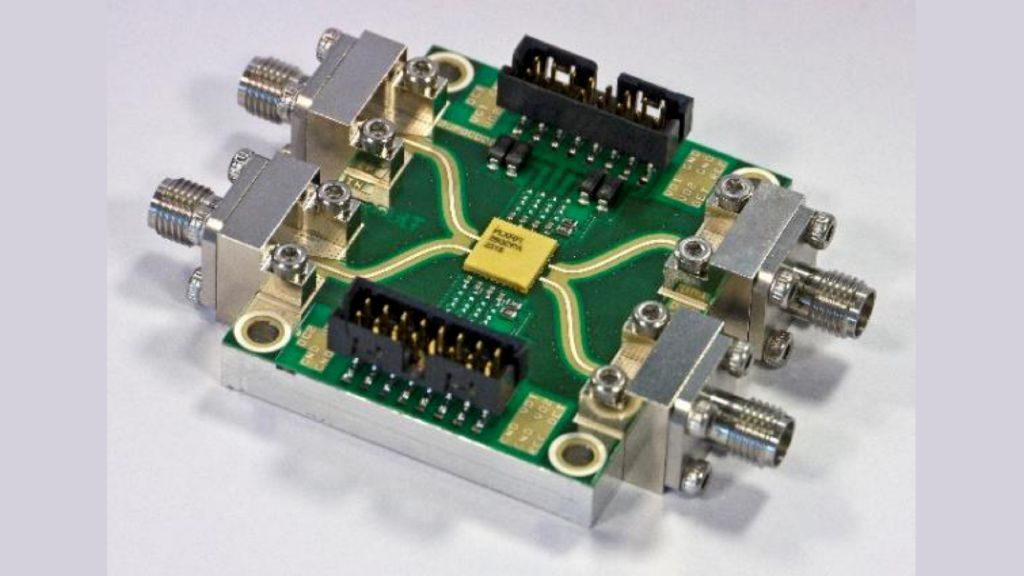
In this presentation, we will introduce some of the main challenges in test and measurement of a device at these frequencies. We will then present the testing of a 26-28GHz pioneer band dual channel amplifier evaluation module using 5G NR test waveforms.

Tudor Williams1, Darren Tipton2, Florian Ramian3

1 Compound Semiconductor Applications Catapult, Regus House, Falcon Drive, Cardiff Bay, Cardiff CF10 4RU, UK

2 Rohde and Schwarz UK Ltd, Harvest Crescent, Fleet, GU51 2UZ, UK

3 Rohde & Schwarz GmbH & Co. KG. Muehldorfstrasse, Munich, Germany

Introduction

Until recently, the 3GPP mobile communication standards have had bands working around the 2- 3 GHz frequency range with single channel bandwidths not exceeding 20MHz. With 3GPP release 15 and the 5 G New Radio (5G NR) technology this changes to provide channel bandwidths of up to 100MHz in sub 6 GHz spectrum and up to 400MHz in the mmWave spectrum.

Comparing measurements between the LTE standard and the 5G version of 3GPP 38.141 it can be seen that many of the measurement methods of LTE have been duplicated to the 5GNR equivalents. However due to the number of additional “modes” in 5G New Radio the number of potential measurements has increased significantly. The key differences are:

  • Frequency Range 1 FR1 (sub 6GHz) and FR2 (mmWave)
  • Conducted vs Radiated measurements
  • FDD, TDD
  • Different Bandwidths (5 to 100MHz or 400MHz)
  • Sub Carrier Spacings (SCS)
MEASUREMENT CHALLENGES

Measurement Challanges

3GPP Documents 38.141-1 describes Conducted Measurements while 38.141-2 works with Radiated Measurements. These documents state that an EVM performance of < 4.5% is required for 256QAM for both FR1 and FR2 frequency ranges.

The document also goes on to discuss the EVM calculation requirements for each channel bandwidth, FFT size and EVM window requirements for each Sub Carrier Spacing used that the analysis signal processing must take care of.

While EVM measurements in FR1 can be made both conducted and radiated the 3GPP standard measurements in FR2 should only be performed in a radiated environment, this is a significant departure from existing standards, and is a direct result of the far higher level of integration require at mmWave frequencies, where is expected there will be no point in the circuit where conducted measurements can be performed, this increases both the design of the system and also the complexity of the testing.

Given a challenging EVM limit of 4.5% in FR2 Radiated Measurements there are three key points to consider and mitigate which the standard does not fully deal with:

  • 1. EVM influence due to Frequency Response (amplitude and phase)
  • 2. EVM influence due to noise
  • 3. EVM due to distortion e.g. non-linear effect of PA

The EVM influence in the measurement is largely covered in the standard as the definition of EVM described in 6.6.3.1 of 3GPP 38.141 includes the use of equalization. This in itself will correct for frequency and phase response of the channel during the measurement.

The EVM influence of the measurement due to noise is more difficult to deal with, certainly in an OTA environment. One must take care of the entire link budget of the measurement system such that the noise performance of the system does not contribute to the EVM of the device being measured.

Testing-24-28GHz-Power-Amplifier-using-5G_02.png

Items 1 can be characterised and compensated using an equalizer, item 3 can be characterized and compensated via digital pre-distortion but whereas point 2 can only be characterized due to EVM measurement but cannot be compensated and only minimised by design. Figure 1 shows the raw performance of an EVM test system with no DUT, highlighting the requirement to optimise link budget at mmWave frequencies which has much less dynamic range when compared to measurementsconducted in the sub 6GHz bands.

For the testing of the DUT in this paper, as the device was connectorized the approach taken was to use 3GPP compliant waveforms and analysis methods such that results could be provided as a useful input to an overall system design.

Testing-24-28GHz-Power-Amplifier-using-5G_03.png

Test Setup

The test setup is shown in figure 1, it consists of a SMW200A Vector Signal Generator with 40GHz RF bandwidth and up to 2GHz modulation bandwidth, an FSW43 Signal and Spectrum Analyser with 43.5GHz RF bandwidth, 2GHz Analysis bandwidth and 800MHz real time bandwidth and a E36313A Programmable DC supply is used to bias the two stages of the amplifier.

The first stage of testing used a release version of option SMW-K144 on the SMW200A, which allowed the generation of extremely clean 5G NR waveforms compliant to the 3GPP standard stated above. This provides a flat frequency response and bandwidths up to 2GHz, along with corresponding FSW-K144 option for the FSW allowing the required in-depth analysis of the downlink signals, using standard compliant parameters within the bounds of conducted measurements in this case.

The second stage of testing looks at digital predistortion DPD of the amplifier to determine the performance of the device when stimulated with a signal accounting for any distortions provided by the DUT. These measurements were performed using 3GPP compliant waveforms whilst making use of the FSW-K18 Amplifier Test firmware provided by the FSW signal analyser. This firmware allows measurement of the device characteristics other than just EVM such as AM/AM, AM/PM, Gain Compression, ACP both with and without DPD being applied to show optimal performance of the device that could be achieved in a final test system.

Device Description

Test Device - 24 - 28 GHz Dual Channel PA

The final operating bands for mmWave 5G will be agreed at the World Radio conference in 2019 (WRC-19), In Europe the RSPG recommended the 26 GHz band (24.25-27.5GHz) as the pioneer band for mmWave 5G in its Strategic Roadmap Towards Europe in November 2016.

Figure 3 shows a picture of a 24 - 28 GHz power amplifier MMIC developed by Plextek RFI covering the pioneer band with impressive performance. The part, which has been designed to have a P1dB output greater than 24.5dBm and gain around 20 dB and achieves PAE above 22% across the band at 1 dB compression and PAE above 7% at 6dB back off.

Testing-24-28GHz-Power-Amplifier-using-5G_04.png

One of the significant challenges in future 5G networks will be the high levels of integration required for example in the phased arrays used for beam steering, here it is likely that we will see the need for multiple mimic’s within a single package.

As an example of this integration, the Compound Semiconductor Applications Catapult commissioned a collaborative development between Plextek RFI and Filtronic to design and manufacture an evaluation module with 2 of the PA mmic’s described above mounted in a single low cost 7mm x 7mm laminate QFN package.

Testing-24-28GHz-Power-Amplifier-using-5G_05.png

The realised dual channel amplifier is shown in figure 4, the performance of the MMIC was very similar to RF on wafer measurements, with only minor changes seen in the both small signal and power performance.

Figure 5 – Gain at Reference input power
Open Lightbox
Figure 6 – ACPR performance at Reference input power
Open Lightbox

Measurement Results

Gain and ACP - Reference measurement

To make the measurement as challenging as possible measurements were conducted using a 5G NR Downlink standard compliant waveform centred at 26 GHz with 400MHz bandwidth and 256 QAM modulation.
The ‘Reference’ RMS gain of the device was measured at a point sufficiently far away from compression to give a result of 19.6dB. The resulting performance is shown in figure 5 in terms of gain and with ACP performance shown in figure 6.

Figure 7 – 24-28GHz power amplifier MMIC
Open Lightbox

Measurements in compression

The maximum input power of the device is rated as 10 dBm peak. Based on this it was decided to drive the device as hard as possible to produce worse case results, just under this level.

Providing input signals at this level results in input power at -1.3 dBm, gain = 19.1 dB and compression of the crest factor of the signal by 1.8 dB.

Under these conditions amplifier achieves a mean EVM of 5.1% (Figure 7)

Figure 8 – 3GPP Compliant in heavy compression “without known data”

Now measuring this device under 3GPP compliant signal processing conditions, the EVM produced is a lower value of 4.69%. (Figure 8). The reason for this is that under 3GPP measurement conditions, the Signal Analyzer will attempt to reconstruct the reference signal during demodulation. Where the demodulation signal is heavily distorted including bit errors, this will produce an incorrect reference signal and hence an erroneous EVM figure.

To measure a correct EVM under these conditions, the system must know the sent signal fully, i.e. must use a known data approach.

This is a key point that device manufacturers and measurement engineers need to be aware of.

Figure 9 – ACP under heavily compressed conditions
Open Lightbox

In terms of adjacent channel performance, the raw amplifier performance has adjacent channel power of 32 dBc at 400 MHZ offset on the lower channel and 33.5 dB on the upper channel.

An ACP measurement was also conducted at a power 3dB and 6dB back off from the compression measurement resulting in 38dBc and 43dBc respectively.

Figure 10 – EVM with DPD applied
Open Lightbox

Measurement results with DPD

It is useful to show how good the device “can be” when compensating for its non-linearities as this is a realistic scenario when used in a final product that would be deployed in the network.

To do this we make use of the built in DPD algorithms of the FSW to allow measurement of EVM and ACP before and after DPD. The algorithm in use for this method of Direct DPD is described in references [2] and [3].

The centre frequency is again 26 GHz, and continues to use a fully loaded, 256 QAM 400 MHz bandwidth carrier. Again, the amplifier is driven at its measurement power pushing the amplifier heavily into compression.

Figure 11 – ACP with DPD applied
Open Lightbox

Resulting performance before DPD is described in Section 5.2 above and after DPD the EVM improves from 5.1% to 1.7%

There is also a dramatic improvement in ACP from 32 dB to ~42 dB with DPD applied.

Figure 12 – AM-AM, AM-PM performance pre DPD
Open Lightbox

The dramatic improvement in AM-PM of the amplifier is clearly shown by figures 12 and 13 where the corresponding AM-PM performance pre and post correction is shown, here it can be seen that an AM-PM of around 10 degrees in compression is reduced to almost a negligible level post correction.

Figure 13 – AM-AM, AM-PM performance post DPD
Open Lightbox

Conclusion

For normal operating condition of amplifiers, being most efficient they are usually driven at or close to compression. To meet the 4.5% EVM target of the 3GPP standard this amplifier would clearly need to have some level of pre-distortion applied.

Measurements of amplifiers when pushed their performance limits gives a number of measurement challenges from dynamic range to accurate and reproducible modulation quality measurements. It is key for the RF engineer to know the limits of their devices under 3GPP standard compliance conditions, but also under realistic operating conditions.

This paper provides an important insight into the design and measurement challenges around the key topic of 5G New Radio in collaboration of a number of industry partners.

References

[1] 3GPP TS 38.141-1 and 38.141-2 v1.1.0, 3rd Generation Partnership Project; Base Station (BS) conformance testing.

[2] Amplifier Characterization Using Non-CW Stimulus http://ieeexplore.ieee.org/iel7/7990360/7999522/07999563.pdf

[3] R&S Application Note 1EF99: Iterative Direct DPD https://www.rohde-schwarz.com/us/applications/iterative-direct-dpd-white-paper_230854-478144.html

Related solutions