Application Notes

Generate moving emitters in the lab without expensive field tests

The R&S®Pulse Sequencer software offers an easy way to simulate moving radar emitters and a moving receiver for EW receiver tests. The software together with the R&S®SMW200A vector signal generator is a powerful radar simulator. It enables engineers to generate highly dynamic 3D scenarios in the lab.

Your task

From slowly moving vessels to rapidly maneuvering airplanes, simulating moving radar emitters is relevant for many test cases. RF level variation at the antenna input of EW receivers due to approaching or departing emitters follows the 1/R2 law. Often the pointing direction of the main lobe of installed antennas changes because of a dynamic change of the emitter or receiver platform attitude. This leads to additional level variations. Testing EW receivers under realistic scenarios is therefore crucial to their reliable performance in the field. However, it is costly and time-consuming to test receivers in their real operational environment. In addition, it could be too late to make major changes to the system if things do not work out as expected. This is why engineers need an easier and faster method to assess the receiver‘s performance.

T&M solution

The R&S®SMW200A vector signal generator equipped with the R&S®SMW-K304 moving emitter option together with the R&S®Pulse Sequencer software turns the R&S®SMW200A into a powerful radar scenario simulator. Radar engineers can quickly model complex moving emitter scenarios with ultralong playtime. They can also:

  • Easily define emitter trajectories such as straight lines or circular arc segments with three degrees of freedom
  • Use vehicle description files to smoothen trajectories that only contain x, y, z coordinates without timestamps
  • Individualize scenarios thanks to imported waypoint files from users for complex trajectories with six degrees of freedom (6-DOF) and time tags
  • Simulate acceleration and Doppler offsets
  • Preview and visualize dynamic 3D scenarios

Scenario definition on the map

The example scenario below shows a radar emitting patrol aircraft (blue) heading east in a straight line. At the map’s origin, a larger, slowly moving aircraft with a radar receiver (red) is turning left, with final heading northeast.

Dynamic scenario on the map

Simulation of a realistic flight scenario

The flight path of the receiver (slowly moving red aircraft) was imported from a trajectory simulator. The flight path is defined as waypoint file (proprietary *.xtd format) that includes location and attitude information with timestamps. The flight path of the emitter (blue aircraft) uses a predefined trajectory provided by the R&S®Pulse Sequencer software. In this scenario, it is assumed that the radar of the blue emitter aircraft operates in the X-band and uses a pencil beam together with a raster scan. The light blue shaded area shows the sector that is covered by the raster scan. The scan rate is 30°/s (raster width 90°). The red aircraft carries radar warning equipment with 360° azimuthal coverage as part of its electronic support measure (ESM) system. It uses four sector antennas with cardioid antenna patterns.

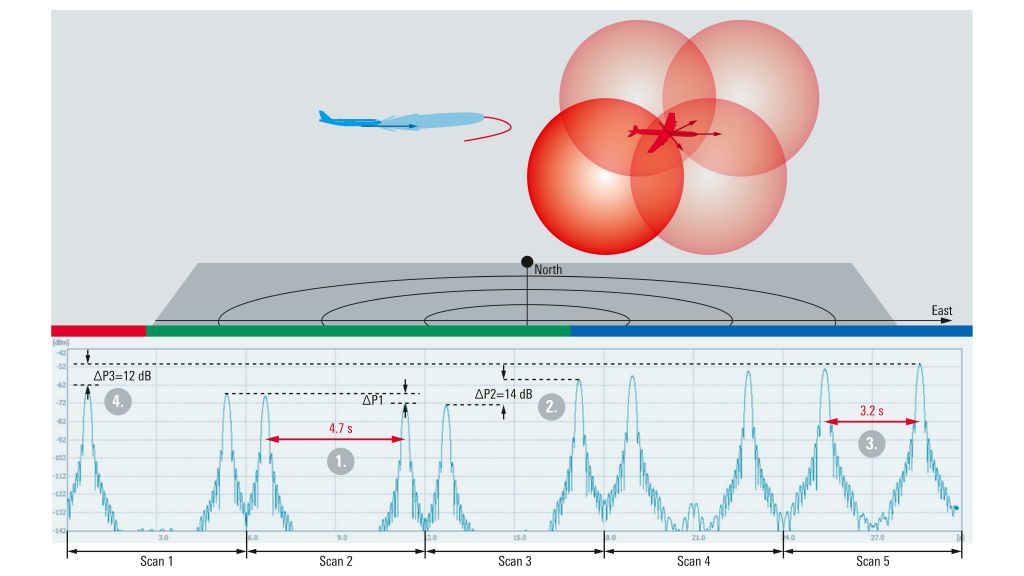
Simulation of the receive power level

The figure shows the level variation due to the previously described flight scenario. Only the RF power level trace of one of the receiver’s four sector antennas is shown. The scenario contains three time intervals (red, green and blue bar). At the beginning of the scenario (red interval), the receiver is located at the 1 o’clock position relative to the emitter heading (blue aircraft). Later, during the green interval, two groups with two peaks each occur. These peaks result from the raster scan of the emitter’s pencil beam (1). During scan 2, the spacing between the two peaks is about 4.7 s. This means that the receiver is located off to the middle of the raster width. As the receiver aircraft rolls left in order to turn, the second group of peaks in the green interval has lower peaks (ΔP1). Due to this flight path, the cardioid antenna pattern is tilted downward. This tilt reduces the antenna gain toward the approaching emitter, causing the received power level to decrease. During the blue interval at around second 17 of the simulation, the red aircraft has rolled back to its initial attitude heading northeast, leading to a significant increase in the received power of approx. ΔP2 =14 dB (2). During the blue interval, the emitter steadily approaches the receiver. The received power increases even more by an additional ΔP3 =12 dB compared with the initial value at the start of the scenario (4). The red aircraft is now almost at the 12 o’clock position relative to the flight path of the blue aircraft. Therefore, the received peaks of the emitter’s transmit signal during scan 5 now have a spacing of 3.2 s (3). The red aircraft is almost in the middle of the raster scan.

Key benefits

  • Simulate realistic fl ight maneuvers with moving emitters and moving receivers
  • Gain insight into level dynamic from a powerful scenario preview
  • Turn the R&S®SMW200A equipped with the R&S®SMW-K304 option together with the R&S®Pulse Sequencer software into a powerful radar simulator
Preview of RF power level at the selected antenna output of the red aircraft’s receiver