Angular error estimation using the R&S®QAR50 phase result
Modern measuring instruments provide a spatially resolved transmission phase that can be used in phase homogeneity evaluation and threshold definition.
Modern measuring instruments provide a spatially resolved transmission phase that can be used in phase homogeneity evaluation and threshold definition.
Your task
For autonomous vehicles, detecting precise object positions is critical. Even small deviations in angular estimations can cause incorrect conclusions in downstream decision-making. Angle-of-arrival (AoA) errors, for example, can be caused by radome inhomogeneities. Due to complex radome-sensor interactions, the exact behavior is hard to predict. To ensure that only qualified radomes are used in the subsequent processes, a reliable measurement method is required that is suitable for end-of-line testing.
Rohde & Schwarz solution
The R&S®QAR50 automotive radome tester is a fast, precise and cost-effective solution for automotive radome testing. The R&S®QAR50 together with the R&S®QAR50-K20 homogeneity analysis (phase mask) option enables the angular error to be derived in the lab and in production.
To prove the applicability of the method, the measured and calculated results from the R&S®QAR50 are crosschecked with the R&S®RadEsT radar essential tester. The R&S®RadEsT is a versatile and extensive automotive radar target simulator that generates user-definable radar echoes at various angles.

Fig. 1: Estimating the direction of a centrally placed point scatterer in far field conditions
Technical background
The first step is to look at the radar signal processing and how AoA estimations are obtained.
The emitted electromagnetic wave propagates through space and is reflected by objects in the signal path. Here, the transmit chain is disregarded and the radar’s receive side is focused on. In this simplified case, assume a single point scatterer under far field conditions. This means that a planar wavefront reaches the receiver. Assuming that the point scatterer is exactly in the center of the field of view, each antenna element (a1 to a5) would receive the planar wave with the same phase (φ1 = φ2 = φ3, etc.) – see Fig. 1.
For non-centrally placed reflectors, the AoA of the wave would lead to a different phase at each receiving element.
The incident angle α of the wavefront is calculated using the phase difference Δφ and the physical distances between the antennas d as such:


Fig. 2: Estimating the direction of arrival for a non-centrally placed point scatterer
Whereas φ = 0° (see Fig. 1) and λ ~ 3.9 mm (77 GHz radar).
For this simple case, this results in αestimate = 0.
An inhomogeneous or improper radome in front of the receivers influences the wavefronts and alters the phases (φ1 to φ5) at each receive antenna element. This leads to an incorrect AoA estimation.

Fig. 3: A wedge-shaped radome refracting the wavefronts and leading to phase differences at the receiving antenna elements
For experimental verification, consider a wedge-shaped radome inserted into the signal path. The radome has a different permittivity than the surrounding air and thus a different propagation speed for the electromagnetic wave. Since the wedge thickness is not homogeneous across the entire imaging region, it refracts the wave and distorts the wavefronts. More information on material characteristics and permittivity can be found in the application card “Characterizing polymer material properties for automotive applications” (PD 3647.5084.92). The described effect is demonstrated in Fig. 3.
The previously orthogonal arriving wavefront is now refracted and arrives at the receiving antennas with an offset angle Δα. The offset is denoted as Δα, whereas the actual incident angle α in this example is still 0°. The radar cannot measure the AoA directly. Instead, it detects the phases of the wavefront at each of the receive antennas.
According to the formula given before, the radar will now erroneously compute the AoA not as 0° but as a function of the phase difference Δφ between the antenna elements. Depending on the geometry of the radome, the calculated Rohde & Schwarz Angular error estimation using the R&S®QAR50 phase result 3 AoA can differ over the field of view (FoV). The detected phases are a superposition of the actual AoA α and the offset angle Δα.


With the R&S®QAR50, it is difficult to measure the AoA influence directly, since the instrument lacks information about the radar geometry and signal processing. However, assuming basic receive beamforming processing, the AoA error introduced by the improper radome can be estimated as:

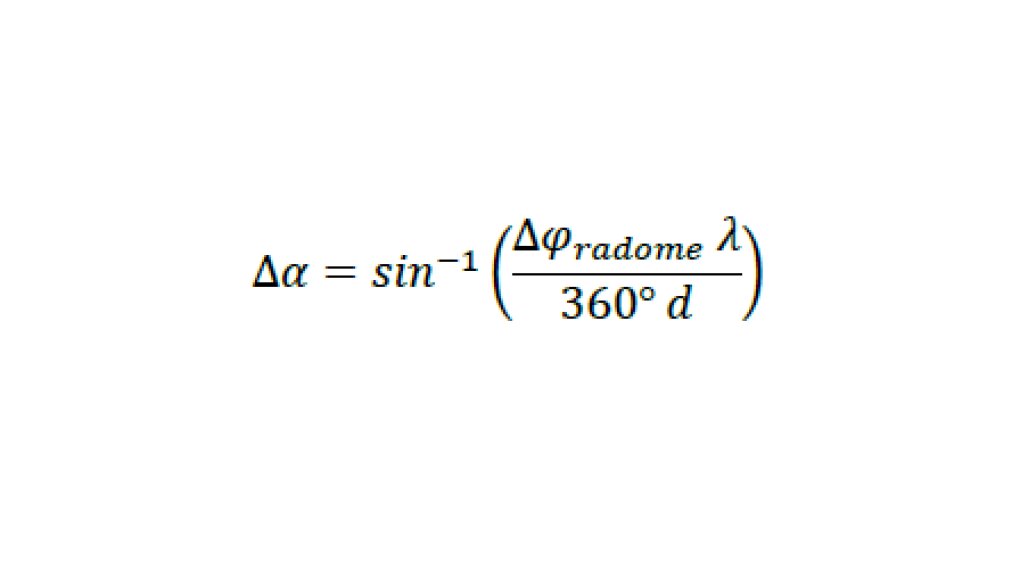
As a rule of thumb for small Δα with the R&S®QAR50 grid evaluation, a deviation of Δα ≈ 0.062 Δφradome /cm can be assumed. This means that, assuming an angular error of 1° is deemed acceptable by the OEM, a maximum phase difference of

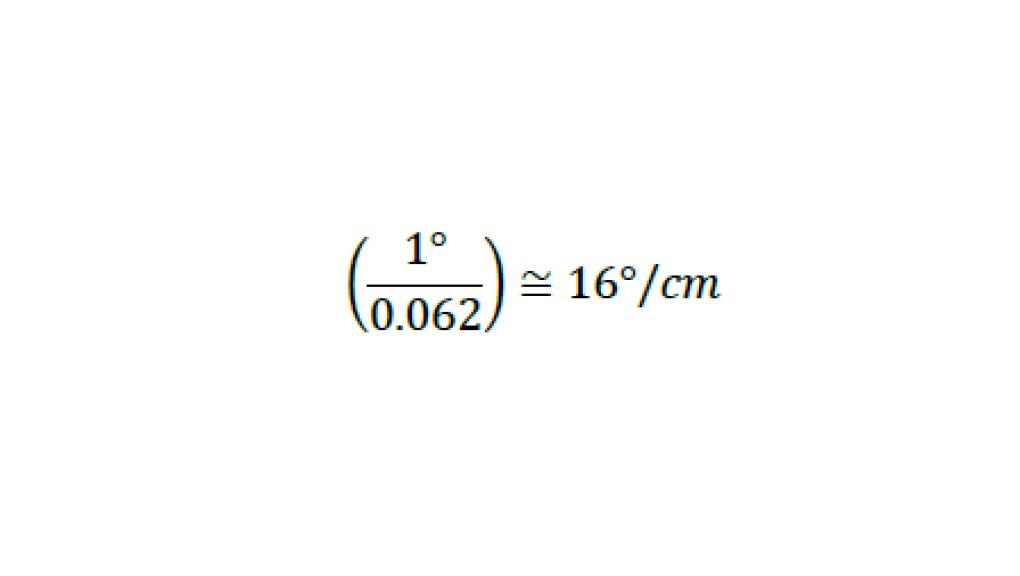
measured by the R&S®QAR50 is permissible. However, this applies to basic geometries and standard beamforming processing only and needs to be evaluated for every radar/radome combination.
The above outlined theoretical deviations must be crosschecked with an experimental verification.

Fig. 4: Dimensions of the wedge manufactured for experimental verification
Experimental verification
For the experimental verification, a polyoxymethylene (POM) wedge with the dimensions shown in Fig. 4 is manufactured.
The permittivity of POM is verified as εr = 2.93 with multiple methods.
The calculation of the resulting refraction of the wavefronts leads to

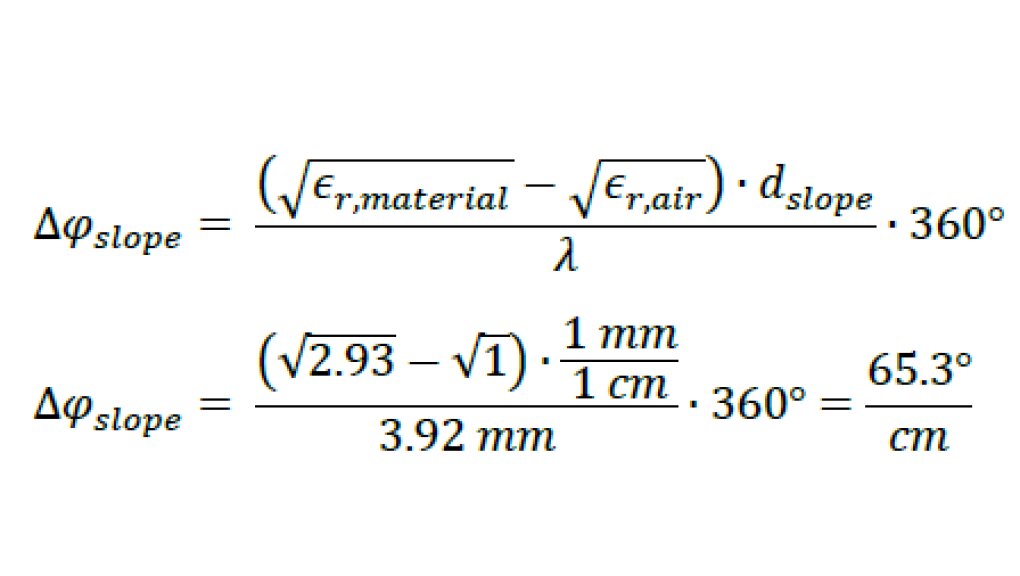

Fig. 5: Phase mask image of the wedge manufactured for experimental verification
First, the theoretically calculated resulting phase difference is verified for the experimental POM plate using the R&S®QAR50. The resulting phase mask is shown in Fig. 5.
With the grid mode activated, the R&S®QAR50 automatically outputs the mean phase of each grid cell. For consistency, a grid size of 10 mm × 10 mm is used. The phase difference between the individual cells is evaluated as follows:


Fig. 6: Experimental setup with automotive radar sensor, wedge-shaped radome and R&S®RadEsT
This results in a mean difference of 66.6°/cm – very close to the calculated 65.3°. The deviation between the two values is caused by production tolerances and measurement inaccuracies.
For final verification, a lab setup based on a fifth generation radar sensor and the R&S®RadEsT radar essential tester is used. The optional shielding is used to improve the accuracy of the test setup and to ensure all measurements are performed under appropriate far field conditions.
The R&S®RadEsT simulator is set up to provide a single target at a distance of 40 m positioned directly in the center of the radar’s FoV. Three tests are performed: a reference measurement without the wedge and two measurements with the wedge being flipped between the recordings. Fig. 6 shows the measurement setup.
With the rule of thumb outlined above, the radar is assumed to output an (incorrect) AoA of approx. ±4.1°, with the wedge direction determining whether it is plus or minus.
The table below gives an overview of the expected deviation of the AoA by the rule of thumb explained above and the measured AoA using the experimental setup.
| No radome | Positive error | Negative error | |
|---|---|---|---|
| Expected | 0° | 4.1° | –4.1° |
| Measured | 0° | 4.2° | –3.8° |
Again, the cause of the deviations cannot be determined with certainty. The deviations may be due to material or manufacturing defects, or they may be attributable to the measurement uncertainties of the instruments and sensors used.
Summary
Although the angular error introduced by an imperfect radome cannot be measured directly, it can nevertheless be derived in a lab setup using the R&S®QAR50-K20 homogeneity analysis (phase mask) option results.
The theoretical phase difference derived from the electromagnetic permittivity (εr = 2.93) and the thickness of the wedge results in 65.3°/cm. This result matches well with the phase difference measured with the R&S®QAR50-K20 homogeneity analysis (phase mask) option of 66.6°/cm.
The theoretical AoA error (denoted as Δα) of 4.0° and the AoA offset estimated using the R&S®QAR50-K20 option of 4.1° match perfectly within the expected uncertainties.
The experimental verification of these two values, using a fifth generation radar sensor stimulated by a R&S®RadEsT radar essential tester, shows that the results of theoretical and experimental approaches can be reproduced in the real world.
Related products


