Increasing confidence of full-bridge converter operation during the design process

Power converters with a full-bridge topology are frequently used in telecommunications and servers that need to be compact, efficient and cost sensitive, making them more complex. Switching patterns for all the main primary switches including synchronous rectifier switches need to be validated after the first protype is built. This complex validation requires proper measurement of switching patterns to prevent catastrophic switching patterns. Expertise and the right measurement tools are essential when identifying unexpected events in the converter switching process.

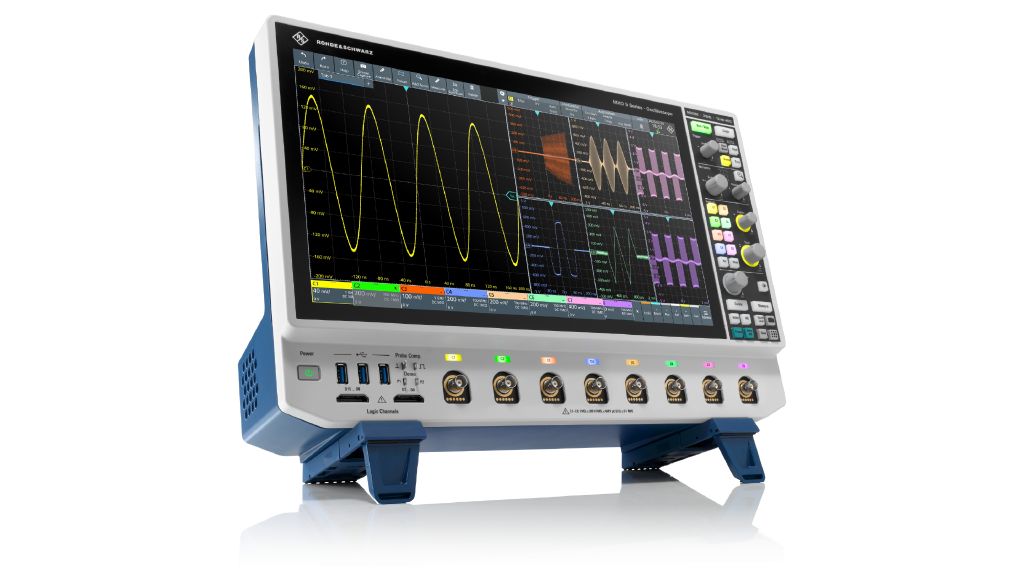
R&S®MXO 5 Oscilloscope

Your task

At the start of the power converter design process, simulations provide initial insights about the switching pattern in complex full-bridge converters with synchronous rectification. The next step is building the first prototype with the selected topology. Validating the initial prototype is essential to being sure about any design decisions and better understanding how a converter functions in the real world. The switching pattern must be validated before continuing with the design process. Converter designs based on digital controllers use software to implement switching patterns, making validation mandatory. A full-bridge converter has very complex switching states and measuring all of them at once is impossible with a standard 4-channel oscilloscope.

When designers measure patterns sequentially, these measurements do not reflect the overall reality of converter operations. Sequential documentation is also very time consuming. An instrument that can measure eight channels at a time would reveal far more faults and help speed up the design process.

Rohde & Schwarz solution

The MXO 5 series oscilloscope is ideal for such measurements because it has eight channels that display all relevant signals needed to validate switching patterns. The oscilloscope has eight channels and automated functions that measure the delay between relevant channels, provide statistical values and ensure the minimum dead time between switches. All gate-source voltage details can be evaluated, such as rise and fall times, overshoot or any undesired oscillations from parasitic components.

Fig. 1: Switching pattern waveforms of a full-bridge converter
Open Lightbox

Application

A 100 W isolated DC/DC converter with full-bridge topology and synchronous rectification measures converter switching patterns. The power stage steps input voltage of 48 V down to output voltage of 12 V and output current of up to 8 A. The converter enters a steady-state after the softstart sequence has been completed as illustrated in Fig. 1.

Device setup

Several tasks need to be completed before the steady-state startup sequence:

  • Select a suitable channel setup including a proper probe
  • Define a suitable trigger to capture the converter steady-state condition
  • Activate measurement functions, including a delay between relevant signals with the history function; proper gate definition also supports this function
  • Define a sufficient sampling rate ≥ 1 Gsample to accurately measure the PWM switching frequency (approx. 100 kHz) with sharp edges
  • Define a proper record length to validate the pattern
  • Use a converter with suitable load and sufficient DC power supply
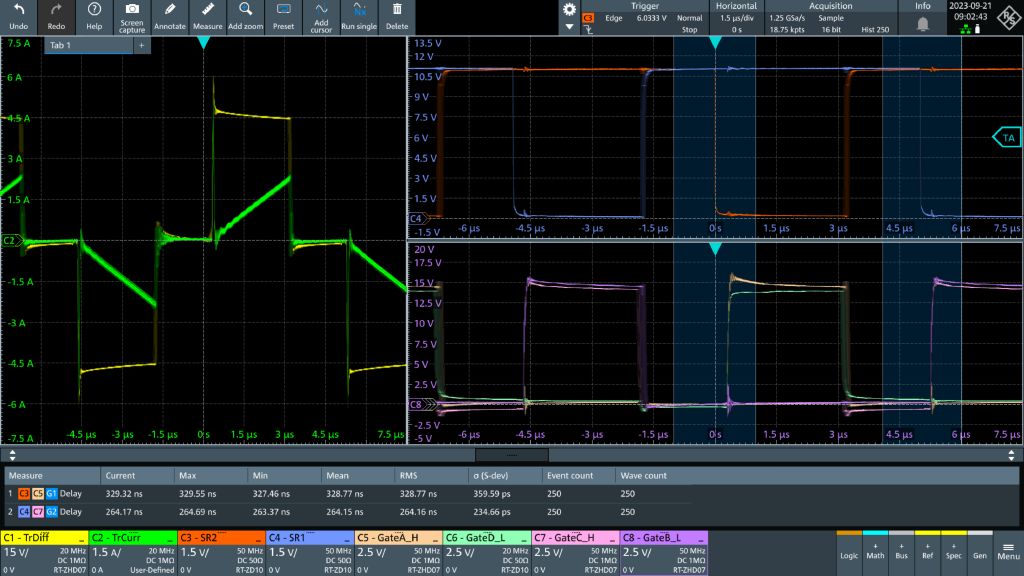
Fig. 2: Measured waveforms of full-bridge converter switching pattern
Open Lightbox

Measuring switching patterns

After setup, switch on the DC power supply to start the measurement. As soon as the trigger detects a valid condition (falling edge trigger), the waveforms will appear (see Fig. 2). The left window shows the transformer (primary side) voltage and current (CH1, CH2). The synchronous rectifier states (CH3, CH4) on the secondary side appear in the top right window. All primary switching states (CH5 to CH8 ) are found in the bottom right window. In general, the switching pattern theory illustrated in Fig. 1 matches the measured waveform in Fig. 2 and the switching pattern has passed the test.

In addition to validating patterns, other parameters should be checked in more detail. The synchronous switch must be turned off before switching on the primary leg. Measuring minimum dead times helps prevent catastrophic shorts in the system. Two gate function definitions let delay measurements be defined for validating the minimum dead time between all relevant switches. Dead time results were measured automatically and included statistics and yields: TSR1 = 264 ns for the SR1 synchronous switch and TSR2 = 328 ns for the SR2 synchronous switch.

Further automatic measurement functions for rise times, fall times and other parameters are available but were not activated in Fig. 2. Automated measurements help validate all these parameters along with the general switching pattern for converter operation conditions. The measurements vary the converter input voltage and the output current.

Summary

The MXO 5 series oscilloscope with eight channels is ideal for verifiying complex switching patterns in full-bridge converters. The oscilloscope allows deeper analysis of waveforms and is included in an automated process that generates statistics. This is great for designers working on complex converter designs and speeds up the design process.