Efficiently testing car TV antennas

Two R&S®ETL TV analyzers or two R&S®ETC compact TV analyzers are used to measure the receive level of a car antenna against that of a reference antenna. The R&S®BCDRIVE broadcast drive test software exports measured data for display in Google Earth.

Your Task

Today's cars have multiple antennas. Recently, UHF antennas for digital TV have been included. The car's design does not usually allow these antennas to be positioned vertically in the center of the car roof, although this would provide optimal functionality. A compromise must be made between design and function.

This makes it all the more important to test the receive level of UHF digital TV antennas in real-world operation. Up to now, drive tests had to be performed in areas with known receive conditions. Receive levels were usually assessed indirectly, by subjectively evaluating the program quality. This approach is time-consuming, inaccurate and difficult to reproduce.

What is needed is a test method that minimizes the number of drive tests. If reception problems occur, it must be possible to determine whether they are caused by the antenna under test or by insufficient network coverage. The difference between the receive level of the car antenna and that of the reference antenna must be displayed for each measurement.

Test setup
Test setup
Open Lightbox

T&M solution

The receive level of the car antenna is measured against that of a reference antenna of known quality. The reference antenna is mounted such that it has optimal receive conditions. In most countries, vertically polarized broadcast signals are transmitted. The ideal antenna position for this is upright in the center of the car roof. Two R&S®ETL or two R&S®ETC TV analyzers are used for the measurement. One analyzer (the slave) measures the receive level of the antenna under test, the other (the master) measures that of the reference antenna.

The master analyzer is connected to an optional GPS receiver so that it can continuously record the car position. The analyzers can be AC-powered from the car's electrical system by using an external power inverter. The R&S®ETL can also be DC-powered from an internal battery or via a 12 V DC input.

Measurements are controlled by the R&S®BCDRIVE broadcast drive test software. It synchronizes the two analyzers, records the vehicle position data delivered by the GPS receiver, and saves all measurement data (including time stamp) at intervals of one second. 100 Mbyte of free memory space is enough for many hours of measurement. If two R&S®ETL analyzers are used, the software can be run on the master directly; no control PC is needed.

Presentation of results

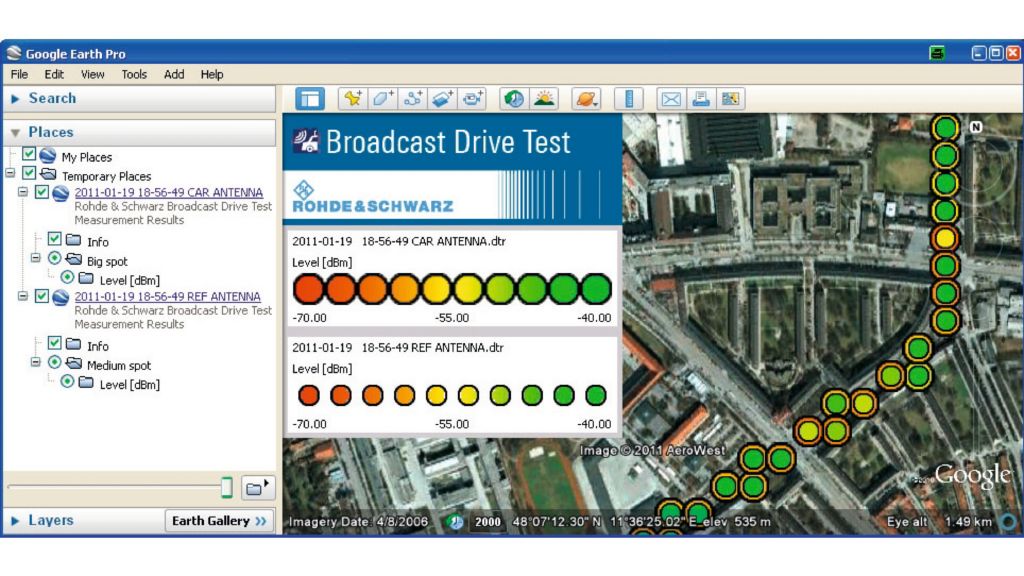
After a drive test, the measurement data is exported from the R&S®BCDRIVE broadcast drive test software and converted to KMZ format for display in Google Earth. Areas with poor reception are easy to recognize.

Comparing the receive levels of the reference antenna and the car antenna shows the cause of reception problems:

  • If the level of the car antenna is poor and that of the reference antenna is strong, the problem is caused by the car antenna
  • If both antennas have poor reception, the receive field strength is insufficient and the car antenna is working correctly

The R&S®BCDRIVE broadcast drive test software also provides measured data in CSV format for further processing with Excel or other programs.

Options for the R&S®ETL TV analyzer are available for the following broadcast standards: DVB-T, DVB-T2, ISDB-T, T-DMB, DTMB, ATSC and ATSC-M/H, and also DAB and VHF sound broadcasting. The R&S®ETC compact TV analyzer supports the DVB-T, DVB-T2 and ISDB-T standards. The application can therefore be used in most countries in the world.

BCDRIVE broadcast drive test software
The R&S®BCDRIVE broadcast drive test software

The R&S®BCDRIVE broadcast drive test software processes measurement results such that the receive characteristics of the car antenna and the reference antenna can be clearly compared in Google Earth. In the screenshot above, the test points are represented by circles. The inner areas of the circles show the receive levels of the reference antenna, the outer edges the receive levels of the car antenna. The levels are indicated by colors, as shown in the legend. In this example, the reference antenna has a receive level that is approx. 15 dB higher than that of the car antenna.

Related solutions