Measurement of inrush currents
All electronic devices contain capacitive or inductive components that can cause a disproportionately high current while switching on the device.
All electronic devices contain capacitive or inductive components that can cause a disproportionately high current while switching on the device.
From an FPGA to a drilling machine, virtually every component or device requires an inrush current that by far exceeds the normal operating current. To properly design the circuitry or calculate safety‑relevant components, it is essential to correctly determine these inrush currents.
The R&S®HMC8015 power analyzer provides seamless acquisition and realtime signal processing as well as a high dynamic range. The versatile display possibilities with the R&S®HOC151 option ensure fast and reliable results.


Typical test setup with the R&S®HMC8015 power analyzer and the R&S®HZC815 socket adapter
The internal current measurement ranges cover ±15 mA to ±60 A (peak). For extended current measurement ranges, the R&S®HOC152 option provides an additional sensor input. This input can be used in combination with external current sense resistors to display smaller current ranges or in combination with current probes to display larger current ranges. For example, the R&S®HZC51 current probe extends the current measurement range to ±1000 A.
Numerical view
If only the maximum inrush current is required, e.g. when determining the cable thickness, the numerical view delivers direct results. The peak value is displayed as IPPeak. If outliers are to be captured, the DUT must be switched off and on again several times. The maximum peak value is then determined using the Peak Hold function.
The current range should be set manually to meet the expected current using the Range Up button. Autorange mode can be reactivated by holding down the Range Up button.


Trend chart view showing six example switch‑on operations
for the DUT
Trend chart view
The trend chart view shows how different the individual switch‑on operations are. The characteristics of multiple switch‑on operations can be recorded and compared in a simple manner.
The measurement can be paused using the Hold button. Holding down the SAVE/RECALL button saves a screenshot to a USB flash drive.
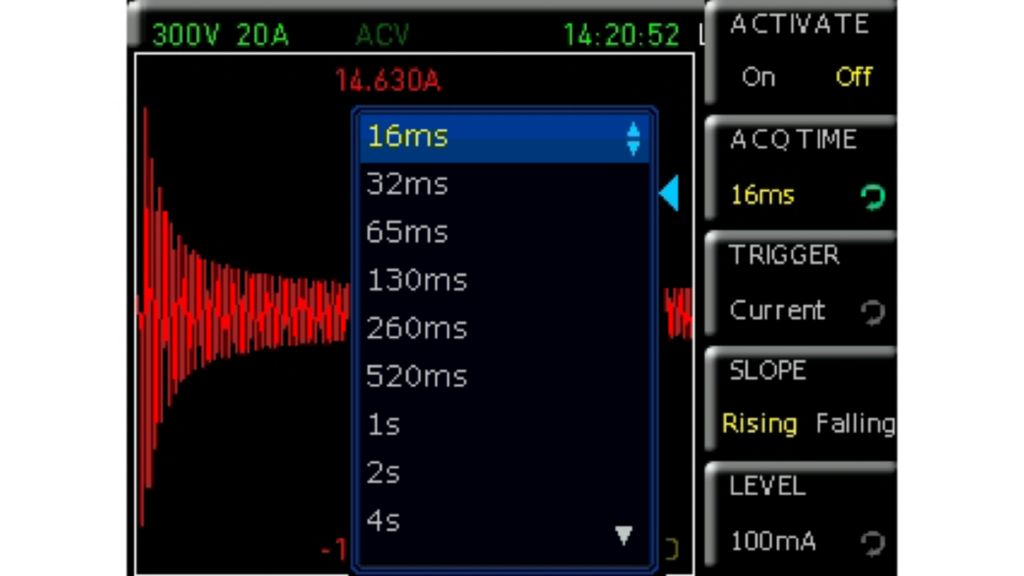
Inrush view
The inrush view is used for more precise analysis of the switch‑on operation, e.g. to determine the melting integral of a fuse. Non‑compressed acquisition of up to 8192 voltage and current points is possible here. A number of trigger options are also available. The ACQ TIME button is used to adapt the recording time to the given requirements.
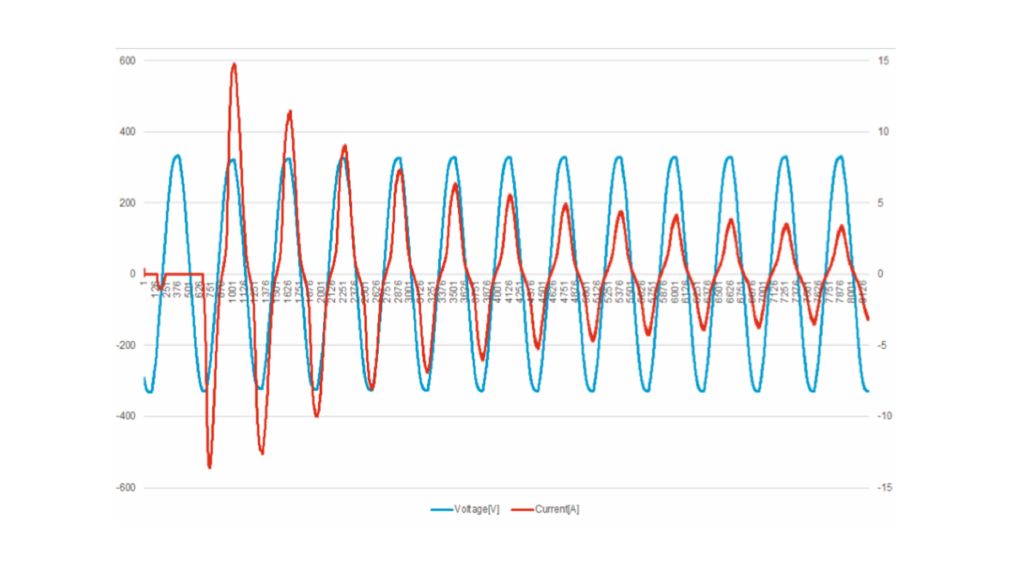
Measurement documentation
After successful measurement, the data can be conveniently saved with full accuracy to a USB flash drive as a configurable CSV file.
The data can then be evaluated on a PC using commonly used data processing software.
Related products