

R&S®FSWP supports external local oscillators
Increase sensitivity with external sources

Increase sensitivity with external sources

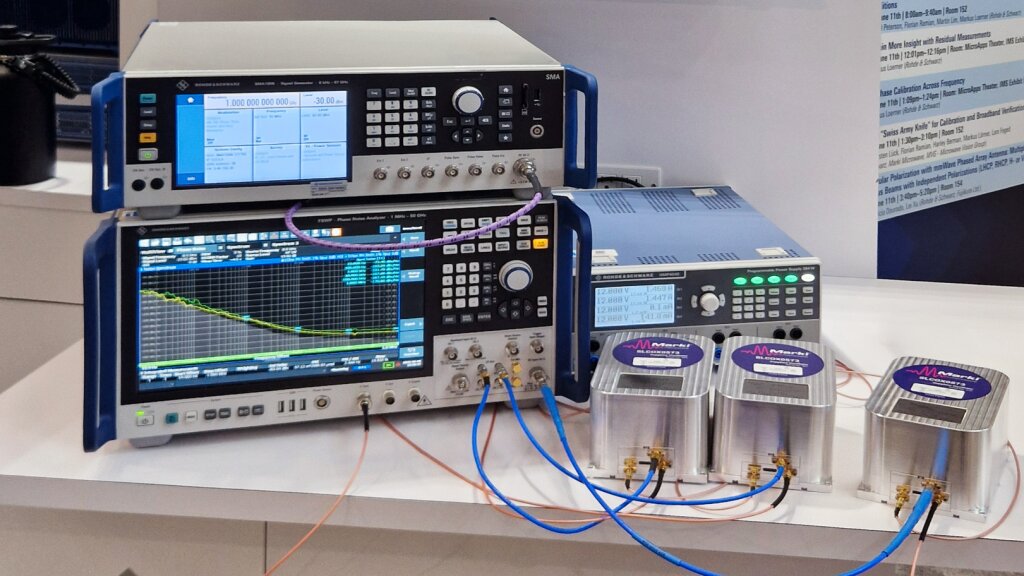
Figure 1: Setup with an R&S®FSWP50 phase noise analyzer, two sapphire loaded cavity oscillators (SLCO) as external local oscillators and one SLCO as DUT
Your task
Modern phase noise analyzers with internal sources and cross-correlation like the R&S®FSWP can measure nearly every signal source like an oven-controlled crystal oscillator (OCXO), synthesizer or voltage-controlled oscillator (VCO) in a few seconds. However, the internal sources have to cover the frequency range from 1 MHz to 56 GHz and cannot compete with high-end sources running at a fixed frequency such as OCXOs, dielectric resonator oscil lators (DRO) and sapphire loaded cavity oscillators (SLCO). These sources have only a small tuning range and an outstanding phase noise performance. In the case of the Marki Microwave SLCO-0800000, a phase noise sensitivity of –157 dBc (1 Hz) with 10 kHz offset at a frequency of 8 GHz needs to be measured.
This can be done with the R&S®FSWP50 at the push of a button. However, more than 10 000 000 averages are needed at 10 kHz offset or approx. 1000 averages at 10 Hz offset to measure the phase noise performance of these oscillators accurately. A huge number of averages works, but it takes time to get the final result. If developers of high-end sources want to optimize their design, they need to get the results faster in a few seconds.
Application
Usage of local oscillators (LO) of the same or similar DUT quality to reduce the number of cross-correlations and to obtain the results faster.
Rohde & Schwarz solution
With the R&S®FSWP, external sources can be used to measure high-end devices. Figure 1 shows the setup, where two SLCOs are used as local oscillators connected to the LO auxiliary inputs CH 1 IN and CH 2 IN. The third SLCO in this setup is the DUT, which is connected to the RF input of the R&S®FSWP. For the LO path even two amplifiers can be added, because their additive noise will be suppressed by cross-correlation. In this setup the LO sources need to run at the same frequency as the DUT. The R&S®FSWP establishes a PLL to lock the external SLCOs to the DUT. On the rear of the R&S®FSWP, tuning outputs are available to lock the SLCOs. They exhibit a tuning voltage range from 0 V to 8 V and a negative tuning slope of around 2 kHz/V. The tuning voltage VTune of the DUT is permanently set to 4 V.

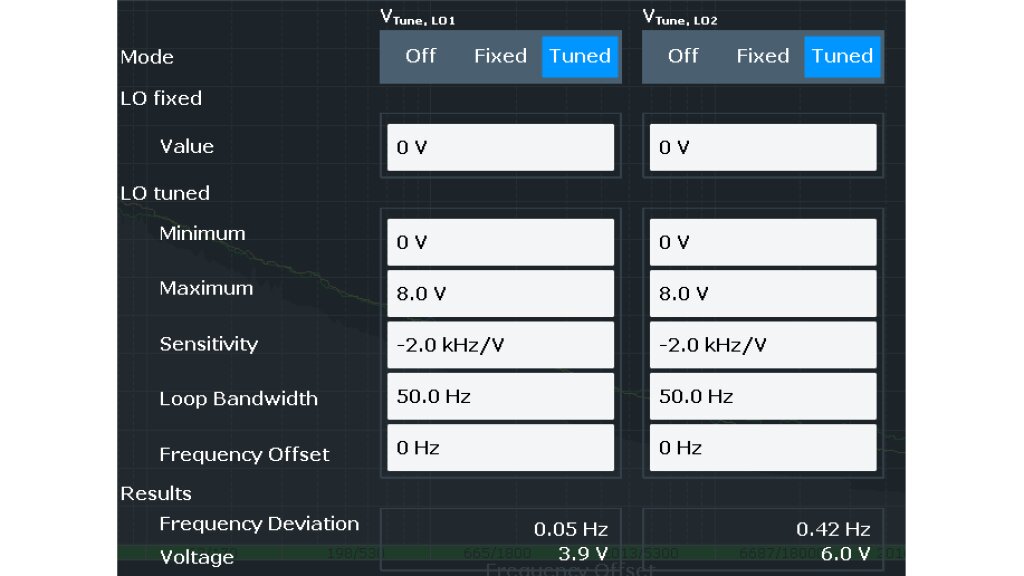
Figure 2: Setup of the tuning configuration of the R&S®FSWP
Figure 2 shows the setup of the tuning voltage menu. Both tuning outputs are set to “Tuned” and the sensitiv ity and tuning range are entered accordingly. In this case the loop bandwidth is set to 50 Hz. The mostly external filtering of the tuning inputs of the oscillators can cause a smaller loop bandwidth than listed here. The frequency deviation and tuning voltage of the sources are listed at the bottom.

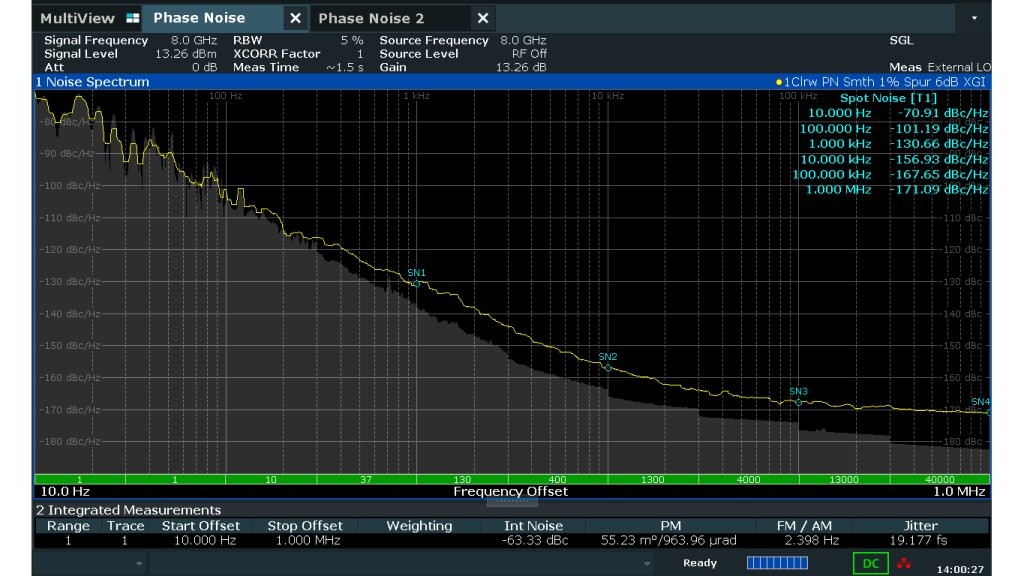
Figure 3: Measurement of SLCO with external LOs with one averaging at 10 Hz offset
As long as the voltages are not at the minimum or maximum value, the oscillators are locked to the DUT and the measurement can be started. Figure 3 shows the result. Only one averaging is needed at 10 Hz offset, which results in 1000 averagings at 10 kHz offset to measure –157 dBc (1 Hz) at 8 GHz. The gray area, showing the cross-correlation gain, is clearly below the trace, indicating that the DUT is measured correctly without limitation by the test and measurement equipment.

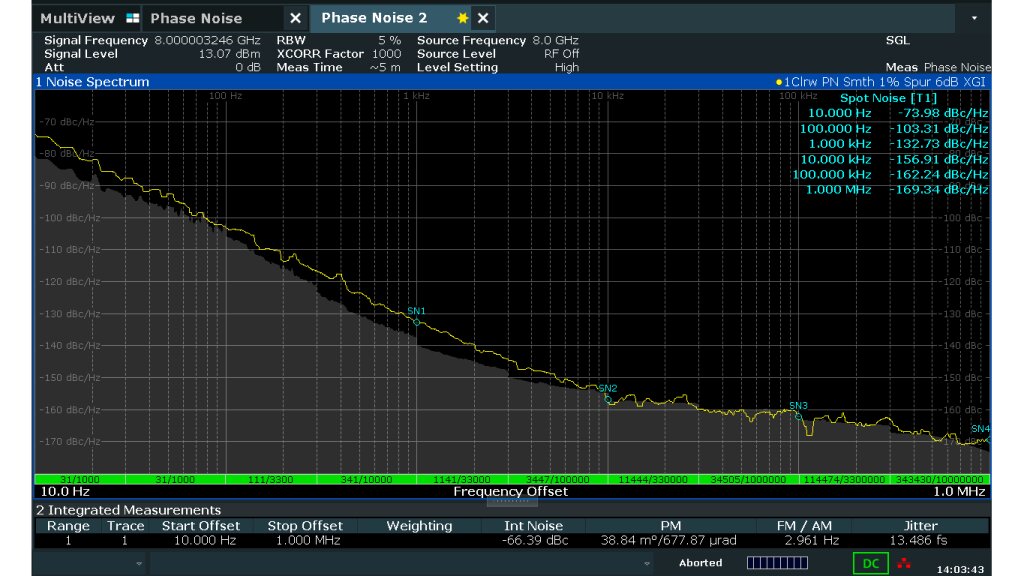
Figure 4: Measurement of SLCO with internal LOs and 30 averagings at 10 Hz offset
Figure 4 shows the same measurement done with the internal sources. The R&S®FSWP displays the same values, but 100 times more cross-correlations are needed to get the gray area clearly below the trace to be sure that the DUT is measured correctly and to obtain a smoother and more reliable trace.
Summary
With the support of external sources as local oscillators, the R&S®FSWP is able to measure even high-end sources in a few seconds, proven for photonic oscillators with a fixed offset [2]. Now the tuning ports make it possible to lock the LOs to the DUT, which enables a wider offset range. In this mode the so-called two DUT method works as well, where the second DUT signal is split and fed to both LO inputs. At the end, 3 dB needs to be subtracted from the result, because the phase noise of the LO is not suppressed by cross-correlation.
References
[1] G. Feldhaus and A. Roth, “A 1 MHz to 50 GHz direct down-conversion phase noise analyzer with cross-correlation”, published in European Frequency and Time Forum (EFTF), York, UK, April 2016.
[2] “Cross-spectrum Phase Noise Measurements of 10-15-level Stability Photonic Microwave Oscillators”, M. Giunta, B. Rauf, S. Pucher, S. Afrem, W. Wendler, A. Roth, J. Kornprobst, S. Peschl, J. Schulz, J. Schorer, M. Fischer, R. Holzwarth, IEEE MTT-S International Microwave Symposium (IMS) 2025, Th2D-4.
Related products
![Architecture of the R&S®FSWP [1]](https://assets.rohde-schwarz.com/public/image/products/test-and-measurement/analyzers/signal-and-spectrum-analyzers/phase-noise-analyzers/fswp/architecture-of-the-rs-fswp-infographic-rohde-schwarz_200_205797_1.svg "Architecture of the R&S®FSWP [1]")
