Measuring power-on behavior of LLC resonant converters

LLC resonant converters achieve very high efficiency levels due to soft switching. However, during the power-on phase such a converter might behave differently until the controller has reached a steady state. Measuring the inrush current and the power-on time ensures that they are within standards and comply with the data sheet.

Your task

Verifying power converter behavior under various conditions such as load changes and power-on are important tasks to ensure reliable operation in the actual application. Inrush currents and power-on time are critical parameters. If the inrush current exceeds certain levels, fuses in the electrical installation network might blow. Power-on time is usually an important specification of a DC/DC converter.

T&M solution

A typical power-on duration of a power converter can be rather long, often several 100 ms. An oscilloscope with deep memory is required to capture such a long time interval and still have enough time resolution to see switching behavior in detail. The R&S®RTM3000, the R&S®RTA4000, the R&S®RTE1000 and the R&S®RTO2000 oscilloscopes provide up to 200 Msample or 1 Gsample of acquisition memory. Combined with their flexible zoom functionality and automatic measurement functions, they are a good choice for these applications. While the switching frequencies of an LLC resonant converter are in the range of only around 100 kHz, the fast rise/fall times of the switches make high measurement bandwidth necessary. High voltage differential probes like the R&S®RT-ZHD probes offer bandwidth up to 200 MHz, which makes them ideal for this kind of application. They also provide a particularly high DC offset compensation range independent from the oscilloscope, which makes them valuable for DC link ripple voltage measurements as well.

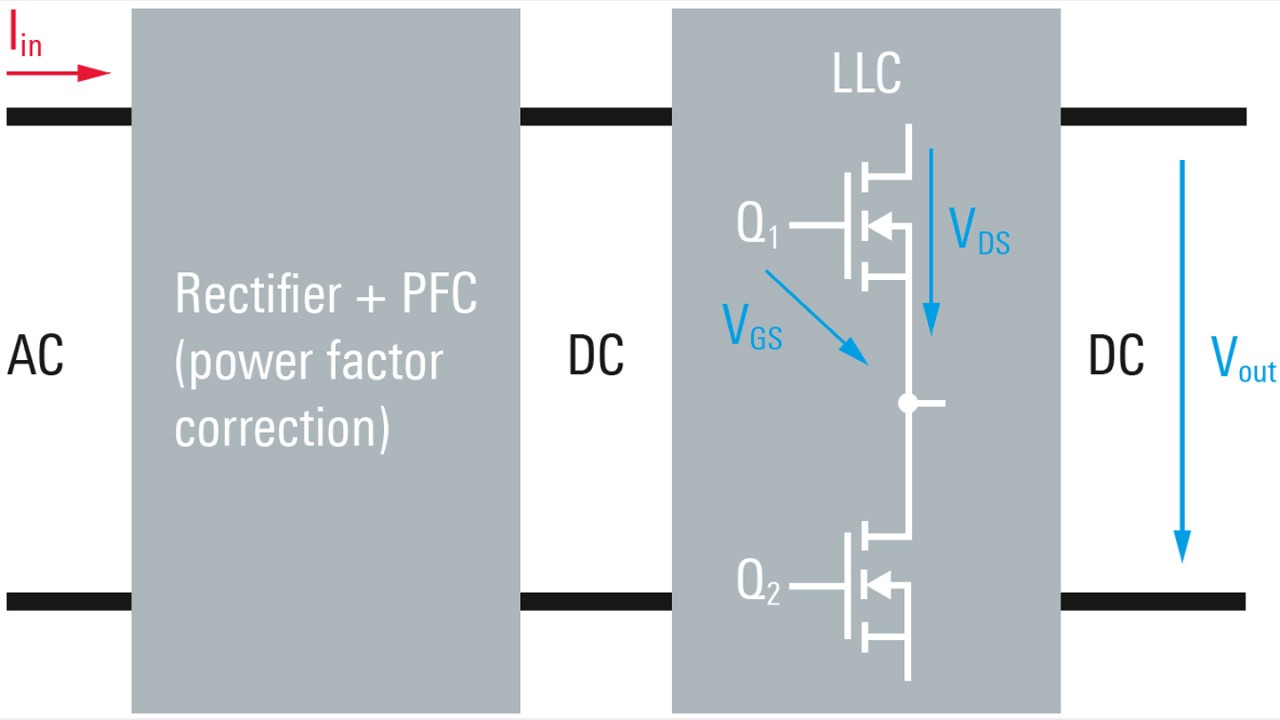
LLC resonant converter consisting of the PFC stage and the actual LLC converter
Open Lightbox

Measurement setup

A commercially available 230 V to 24 V DC power supply for industrial applications is used as the device under test (DUT). The LLC converter consists of a power factor correction (PFC) stage and the actual LLC converter (see figure below).

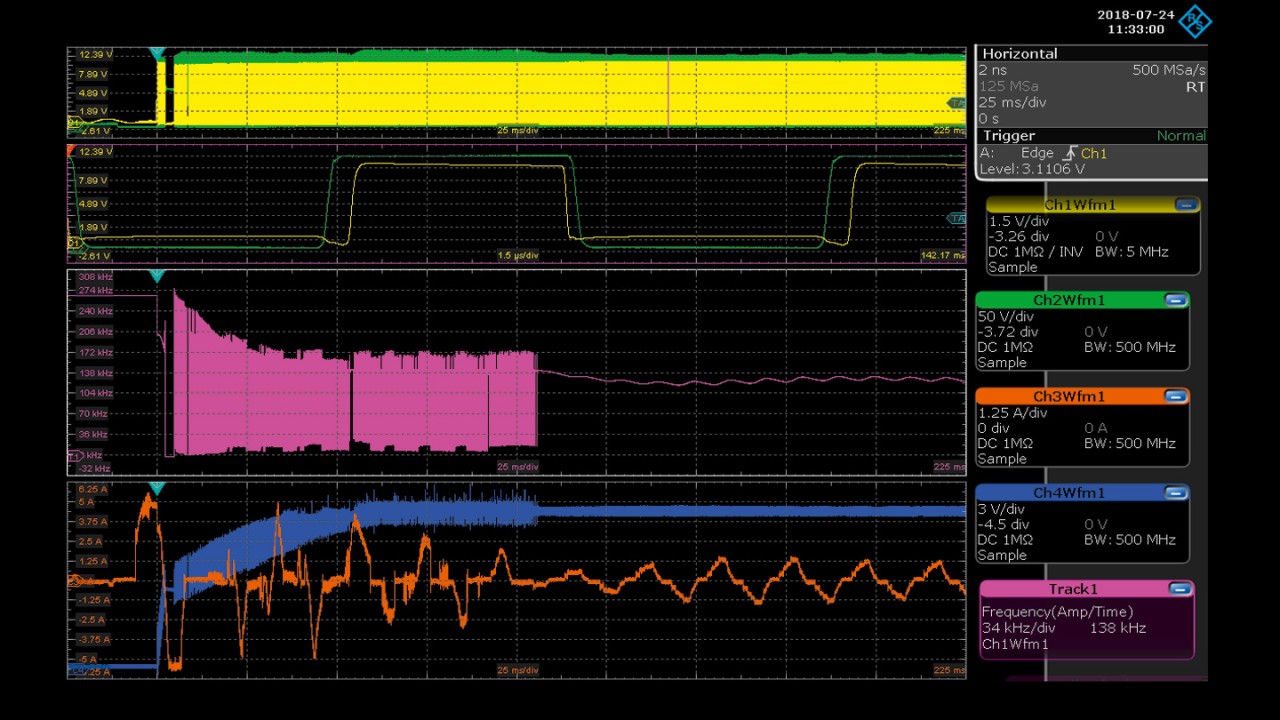
The measurement is performed with an R&S®RTO2000 oscilloscope. The results are shown in the figure below. Two R&S®RT-ZHD16 high voltage differential probes are used to measure VGS and VDS of Q1 (yellow and green). The inrush current is measured with an R&S®RT-ZC20B current probe, and the output voltage with an R&S®RT-ZP10 passive probe (orange and blue). An electronic load regulates the delivered output power. A frequency measurement versus time of VGS is shown in purple.

Results
Results
Open Lightbox

Results

The long record length allows simultaneous evaluation of the startup behavior and the transition to continuous conducting mode. During the startup phase (2), the gate driver starts at higher frequencies (shown with the track function in purple) to regulate the gain of the LLC converter. However, the controller of the gate driver inserts gaps, which are indicated by a close-to-zero switching frequency. The inrush current (orange) is controlled by the PFC circuit, while the output voltage is ramping up to 24 V (blue) in this phase (4). A steady state is reached after the startup phase. The start frequency and the control loop design influence the time needed to achieve a steady state.

In continuous mode (3), which is achieved after approximately 110 ms, the frequency of the totem pole (half-bridge) switching circuit shows 100 Hz modulation. This indicates variations of the primary rectifier in the DUT. During consumption of the capacitor tank charge in the decreasing half-sine wave, less voltage is offered to the LLC resonant converter. Therefore, the switching frequency needs to be adjusted to vary the gain of the circuit in order to deliver a constant DC voltage at the output of the DUT.

Summary

Analyzing the startup behavior of power converters requires oscilloscopes with deep memory in order to capture the relatively long startup phases and probing solutions for safe measurements on high voltages. Measurement bandwidth is important since switching times are often very short. The probing point for VGS of the high side switch is affected by common mode. High voltage differential probes need to suppress this effect via a good common mode rejection ratio (CMRR). Automated measurement functions in combination with track functionality make it easier to analyze single events (such as power-on) and reveal “long-term” variations such as the internal variation of 100 Hz.