Written by Michael Lorenz | July 4, 2018

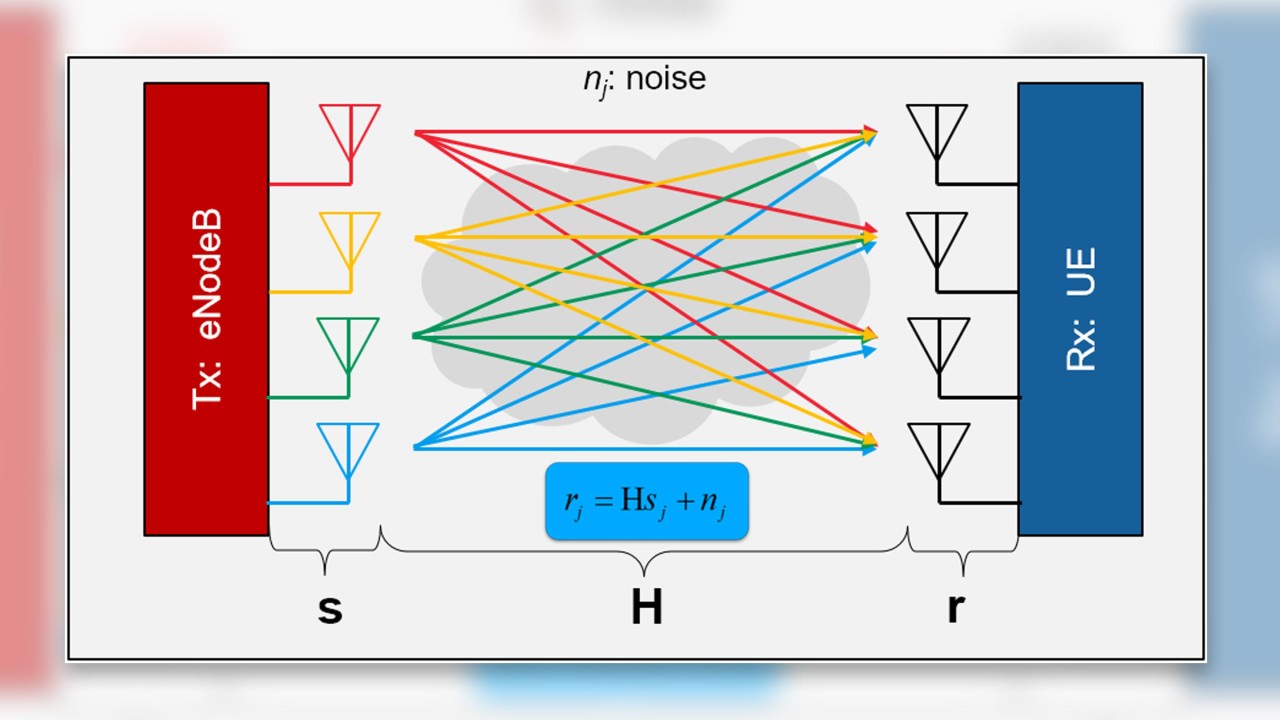
Four Tx antennas at the base station (eNodeB) site and four Rx antennas in the user equipment (UE) are the prerequisite for 4×4 MIMO deployments. The antennas at each site (eNodeB and UE) have to be uncorrelated to provide independent paths as a baseline for up to four different data channels at the same time. Early LTE networks offer 2×2 MIMO features with a maximum of two different data streams simultaneously. The number of independent data streams is known as “rank”.
Gain potential of 4×4 antenna configuration
What are the potential improvements of a 4×4 MIMO deployment in general? With good radio conditions (high SINR) at the cell center, 4×4 MIMO will definitely double the peak data rate because four independent data streams are used instead of two. Rank 4 trumps rank 2.
Transmission modes TM3 and TM4 for single user (SU) are possible. Moving away from the cell center towards the cell edge, radio conditions will degrade at a certain point and the paths might now be partly correlated, reducing the number of ranks to 3 or 2. In the rank 2 area, let’s call it “mid cell”, it is possible to broadcast the same data stream over multiple antennas, as shown in the picture. This diversity gain will increase the data throughput compared to a 2×2 scenario at the same location.

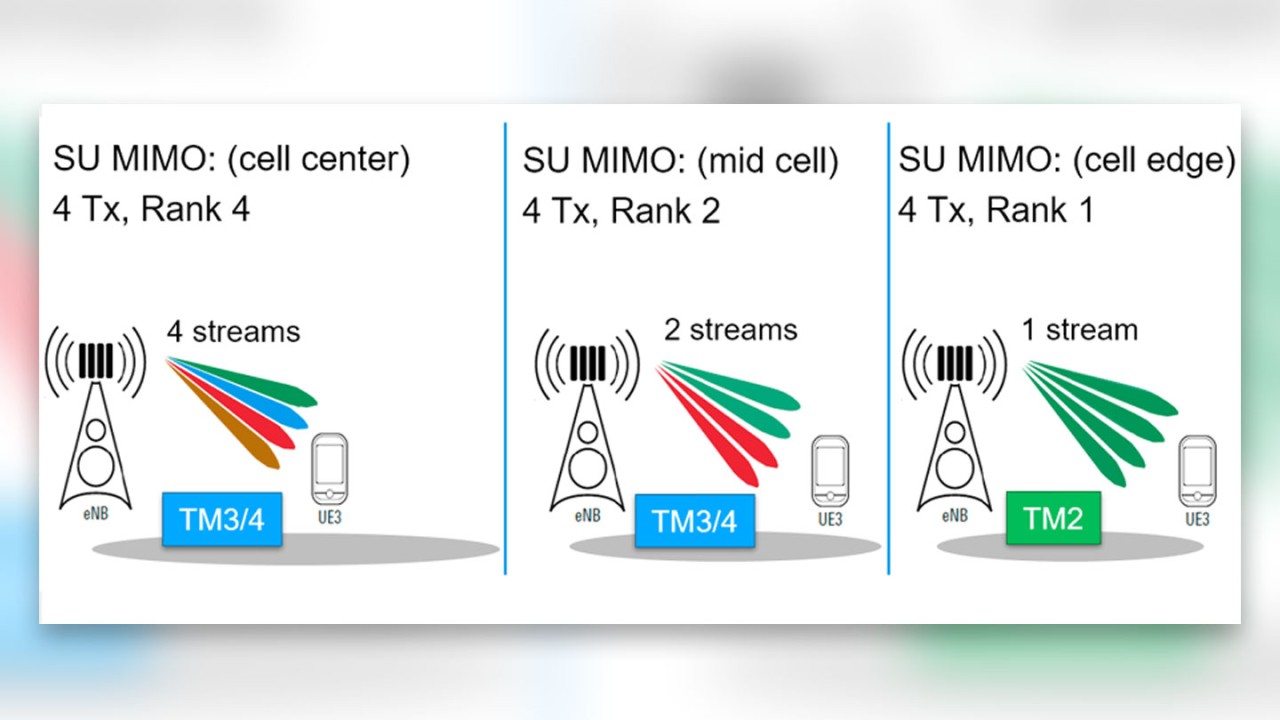
4×4 MIMO gain potential: Depending on radio conditions and antenna decorrelation, a decrease in the number of ranks, from 4 to 1, is achieved.
eNodeB and UE deployment challenges
Today, cross-polar antennas are deployed in traditional 2×2 MIMO networks. To add uncorrelated third and fourth antennas to the system, a second cross-polar antenna can be used. Horizontal or vertical spacing is needed for the decorrelation.
For LTE low band (700-900 MHz), a distance of up to 4 meters would be required to achieve a spacing of d ≥ 10λ. Such a deployment is highly unlikely in most markets and therefore new dual cross-polar antennas are developed and used.
This results in a trade-off between a good decorrelation of both antennas (d ~ 1λ) and a small form factor. Even if the feeder lengths are similar, the risk of mismatching the correct antenna ports of such multiport antennas (antennas with up to 16 ports are commercially available today) remains high.
The bigger challenge, however, is the integration of 4 Rx antennas into a device (smartphone). Even with increasing sizes of smartphones, 4 Rx antennas support only the LTE high bands (1700 – 2600 MHz). However, whether a device supports 4×4 MIMO depends on the UE capability controlled by the
- built-in antennas,
- chipset,
- firmware,
- and SIM card profile.
Evaluating and validating 4×4 MIMO networks
Scanners offer an optimal approach to evaluate and validate 4×4 MIMO networks. Non-intrusive network scanners bypass the uncertainty of devices (smartphones). First, the network performance should be validated with scanners that do not need SIM cards. For a true 4×4 measurement, 4 receivers and 4 Rx antennas are needed to measure and determine the so-called H-matrix of the 4×4 setup, including the 16 individual paths Tx_i/Rx_j (i,j = 0, 1, 2, 3).
By solving these linear equations the rank and condition number are derived. The rank represents the maximum number of possible independent layers (data streams) and the condition number is a measure for channel quality. Condition numbers are dependent on the rank and cannot be compared between different ranks.
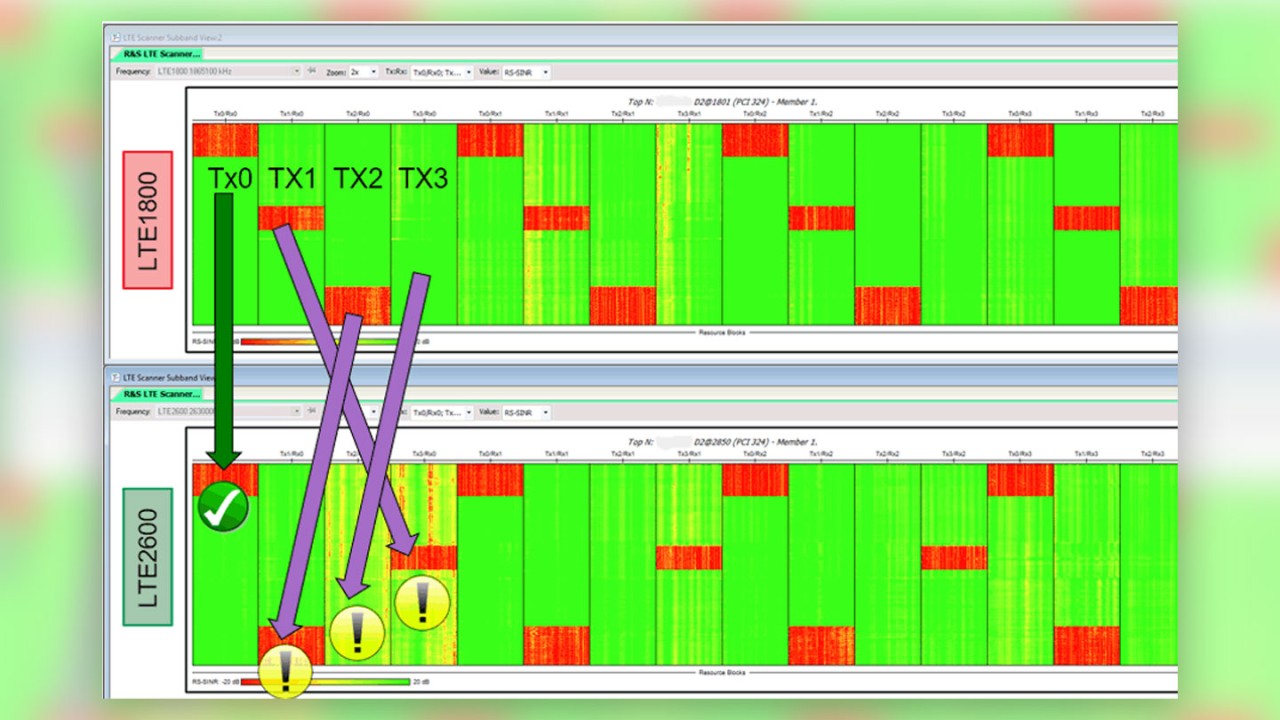
Network scanners from Rohde & Schwarz, such as the R&S®TSME or R&S®TSMA, are ideal for scanner-based health check measurements. The detailed LTE scanner sub-band view (left) visualizes the individual 16 Tx_i/Rx_j measurements (RS-RSRP, RS-SINR or RS-RSRQ) for the full bandwidth and all resource blocks (RB). Abnormal behavior directly pinpoints the problem, e.g. poor antenna installation, insufficient decorrelation or even faulty antenna paths.

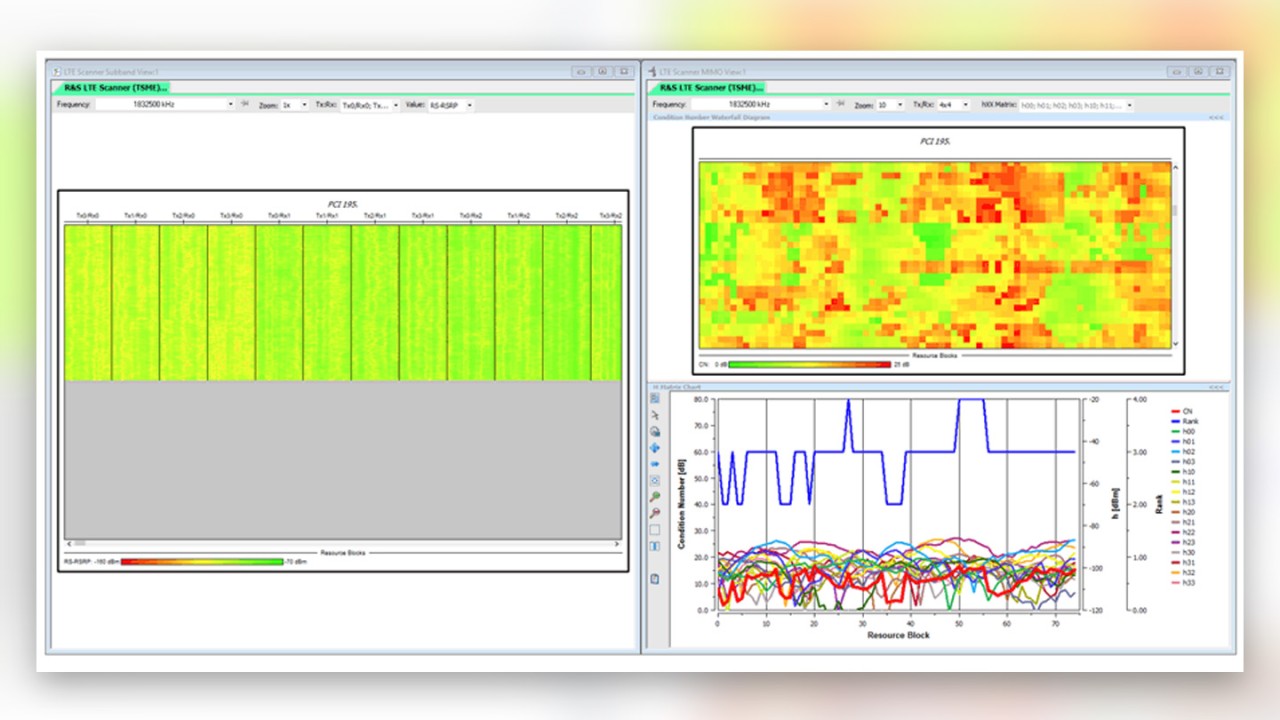
R&S ®ROMES4 LTE scanner sub-band and MIMO views
The LTE scanner MIMO view (right) displays the color-coded condition numbers (green: good; red: bad) for the entire spectrum (upper right). It also shows the individual hxy elements of the H-matrix and the rank and condition number per resource block (lower right). Condition numbers can be compared only for the same rank and not between different ranks.
An example of a mismatched eNodeB antenna port is shown in the image below: In this real-field installation, a non-recommended multiport antenna and two conventional cross-polar antennas with a horizontal spacing were used.
Using a combiner, the LTE1800 and LTE2600 bands to the antennas were overridden. The smartphones never showed high data throughput at LTE2600 because neither rank 4 nor rank 3 could be achieved. Validating the antenna configuration with the scanner setup clearly showed the swapped feeders for the four Tx paths.
Where Tx0 has been combined correctly, Tx1 has been mapped to Tx3, Tx2 to Tx1 and finally Tx3 to Tx2. Such investigation can only be done with scanners and not with mobile phones. A mobile phone reports low data throughput and low rank indicators but it cannot identify the root cause.
Mobile measurements are essential to get the true end-user experience.
Based on sub-band measurements, the universal drive test software R&S®ROMES4 calculates an estimated CQI and throughput per layer and resource block. The scanner is able to decode the BCH messages without using a SIM card. Therefore, the number of deployed Tx ports, which is part of the MIB/SIB messages, is decoded per measured cell.
Mobile measurements are essential to get the true end-user experience. The QualiPoc Android handheld test and troubleshooting solution is based on modified commercial smartphones using Qualcomm or Samsung chipsets. Beside various KPIs, all layer 1 to layer 3 information and messages can be traced for a deep dive analysis. RF measurements per Rx antenna in combination with carrier aggregation, used modulation schemes, rank information and the resulting throughput are only a few of the available information elements.

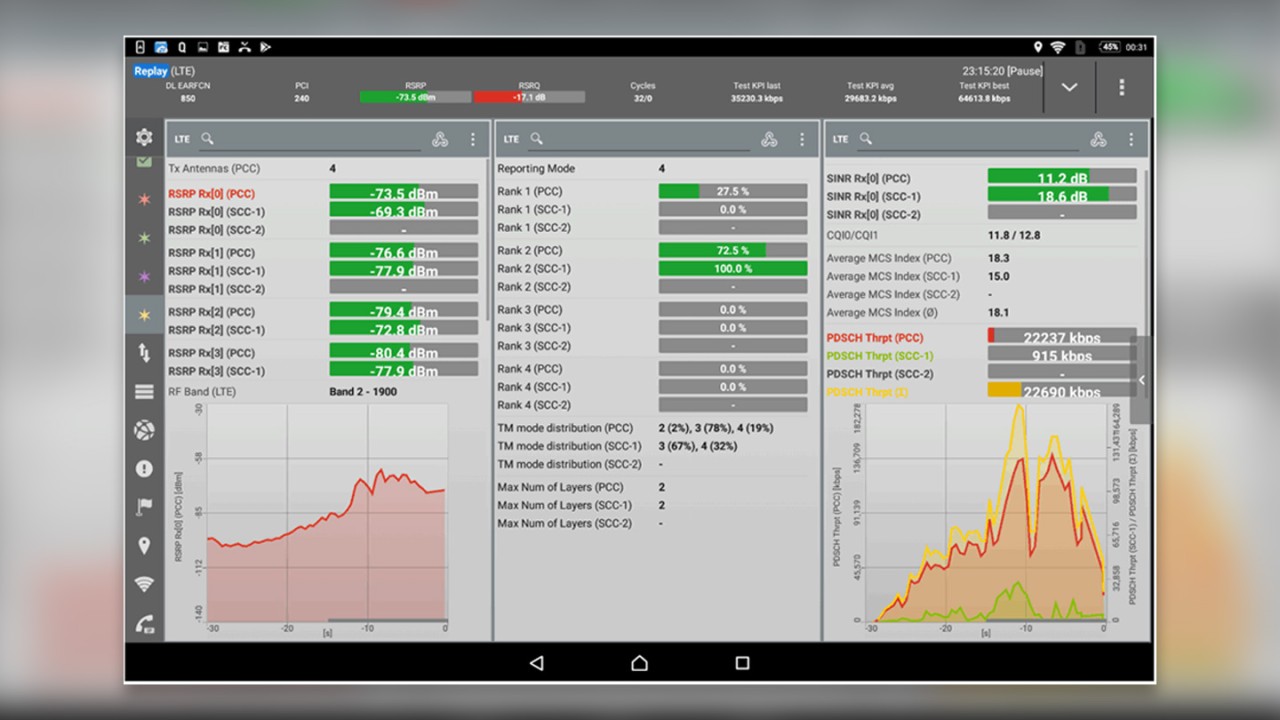
QualiPoc Android shows various detailed RF measurements per Rx antenna.
4×4 MIMO network boost example
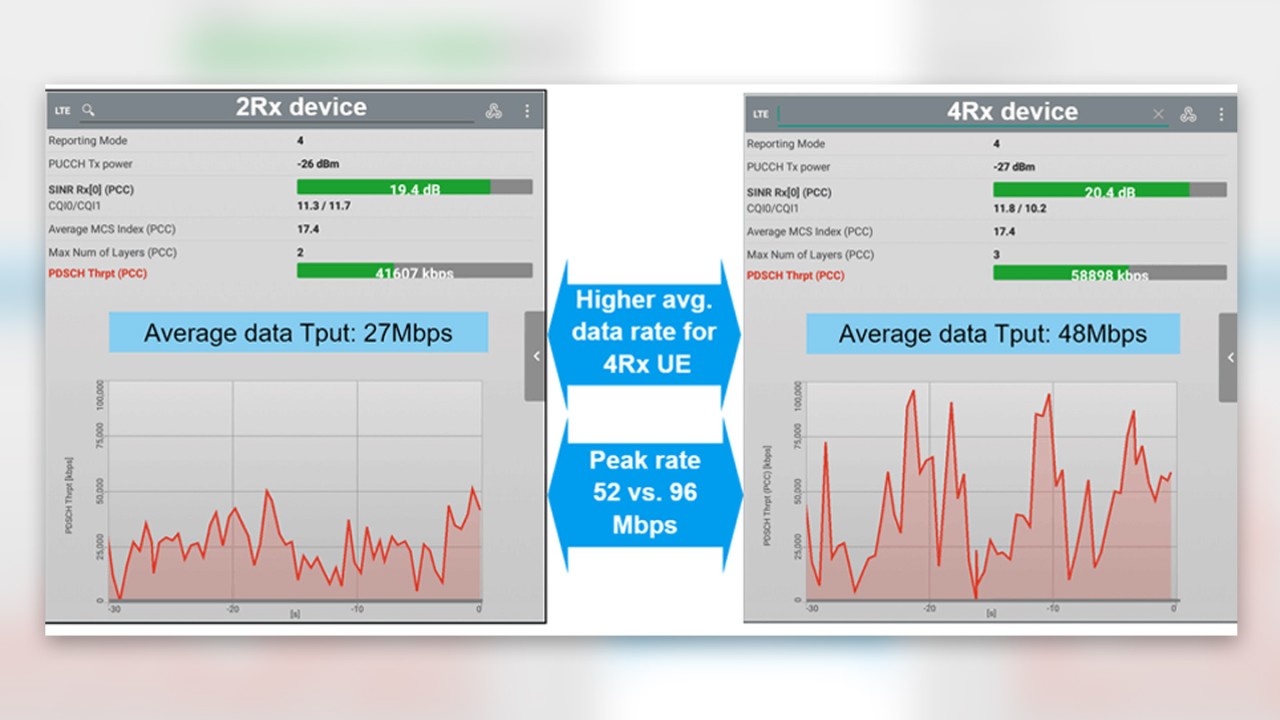
The network boost through 4×4 MIMO is evaluated by comparing a 2Rx vs. 4Rx device in the same 4×4 MIMO network. As described earlier, the two additional transmitter and receiver antennas push the overall throughput by using higher ranks (higher layers) and additional Tx diversity gain.
This example shows a significant data throughput boost of 78% in average and 85% for the peak data rate. At some points at the cell edge, rank 4 could be observed. However, at the end of the day the eNodeB’s scheduler takes the decision about the used modulation, transmission mode, rank and resource block usage. The scheduler algorithm differs among infrastructure vendors.
The weak link: UE antenna design
There is no doubt about the huge challenge to create a proper antenna design for small devices like smartphones that have to support more and more bands and band combinations.
Not achieving the desired data throughputs in a 4×4 (also 2×2) network is not necessarily due to a bad radio network; in most cases, it is due to a limited UE performance. The scanner health check helps to eliminate network issues, including the Tx antenna installation, as the potential root cause.
Uncorrelated antennas in the receiving device need a low envelope correlation coefficient (ECC), which can be only measured in the lab. These measurements are complex and costly.
On the other hand, balanced receiver antenna paths are also key to a MIMO success story. QualiPoc Android connected to R&S®ROMES4 provides such deep insight. The following picture shows QualiPoc Android results in band 2 (LTE1900) and band 4 (LTE2100).

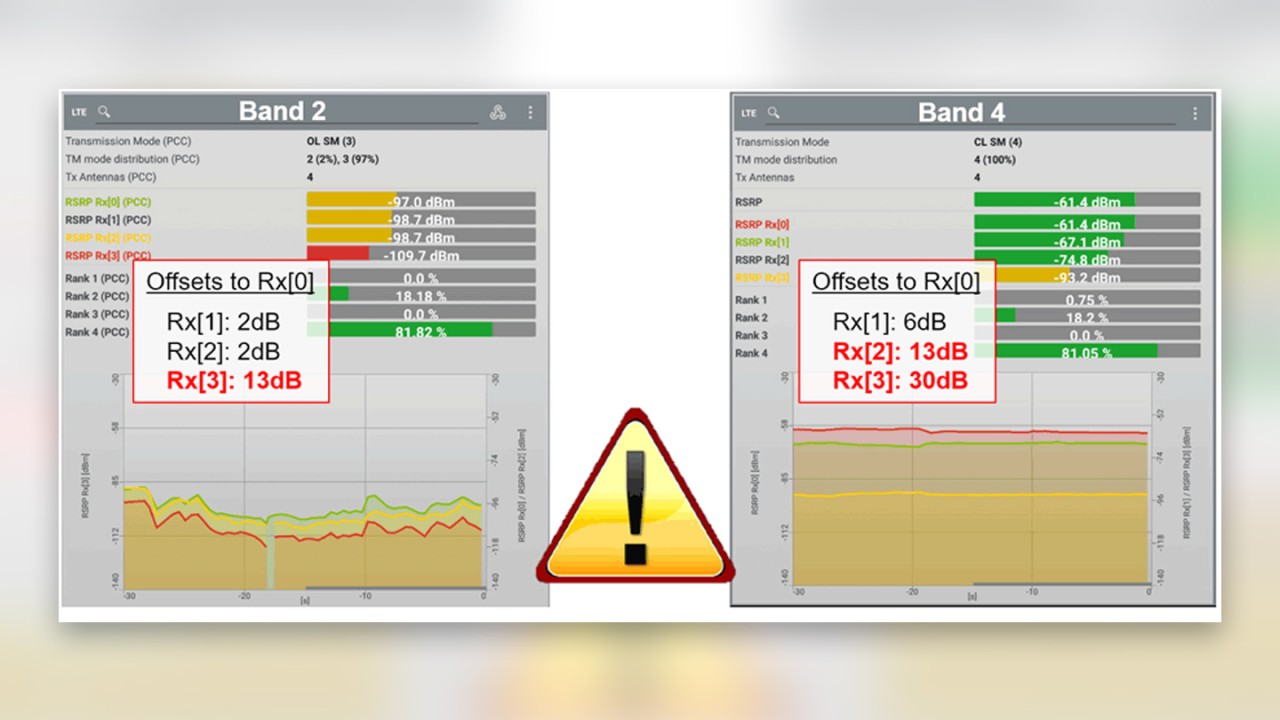
Using the same smartphone, antenna imbalances for all Rx antennas and in two different bands could be observed.
The differences between Rx[1], Rx[2] and Rx[3] to the main antenna Rx[0] are measured and determined as “offset” in dB. For 4×4 devices an offset of maybe 6 dB might be acceptable, but the higher the offset, the more unlikely is the usage of higher-order MIMO.
The device in the example would have problems to get a rank 4 contribution in fair or poor radio conditions because the fourth antenna (Rx[3]) is 13 dB off compared to the main antenna. The imbalance of the second (Rx[1]) and third antenna (Rx[2]) in band 2 is perfect.
The same device shows a much worse result in band 4. With rank 3 at a disadvantage, rank 4 could most likely be observed only under perfect radio conditions very close to the base station.
These results should encourage the industry to have a closer look at the UE antenna performance and to improve the device antenna design further.
To learn more and get answers from the experts, visit our dedicated website and watch the webinar “Boost your network with 4×4 MIMO”.


