Automated spectrum clearance in LTE and 5G mobile networks

Spectrum clearance in mobile networks is becoming ever more important as operators use new bands that previously contained other services. This is particularly important for the 5G NR rollout. 5G NR has already initiated a worldwide deployment of TDD networks in an unknown radio environment where unwanted transmitters can create uplink interference masked by downlink signals, making interference hunting particularly demanding. Automated detection of interference signals before a network switches on can be a big help in addition to traditional manual techniques.

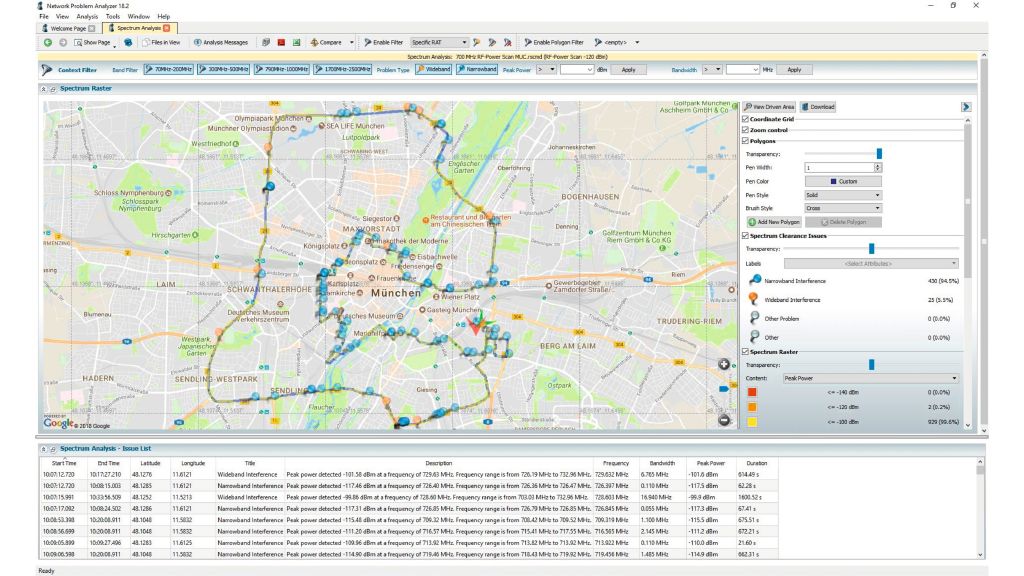
Automated recording of interference signals using the R&S®ROMES4NPA network problem analyzer.
Open Lightbox

Your task

Prepare new frequency bands for the deployment and switching on of LTE or 5G NR networks by characterizing the radio environment and performing spectrum clearance. The first task is identifying and eliminating external interference sources that cause the most uplink problems. If a new TDD network is being rolled out, the task is even more critical, since downlink and uplink signals share the same frequency band and are separated only in time. In TDD, a network’s high-power downlink signal can mask uplink interference during the interference hunting process.

Finding and eliminating interference sources is more complex in TDD systems than FDD systems. We highly recommend identifying interference sources before going live with a TDD system. Automating this task vastly reduces the time needed for and the difficulty of the process.

The following is needed before switching on a network:

  • Identifying and mapping of interference sources
  • Handing over location, frequency and spectral shapes to interference hunting teams
  • Finding and eliminating the sources of interference

Rohde & Schwarz solution

Start with a drive test in the area using a fast and sensitive scanning RF receiver to detect and record the location, frequency and spectral shape of interference sources. The results are then handed over to a postprocessing tool to analyze and identify signals that meet certain criteria, such as minimum receive signal levels.

Compared to directly deploying interference hunting teams with spectrum analyzers or handheld receivers and manually searching for interference (the traditional way), the automated method has three big benefits:

  • Identifying potential interference signals and their characteristics is far faster
  • Collecting and analyzing data are separated, meaning time-consuming data collection can be done far more quickly with fewer skilled personnel
  • The experts in interference hunting teams can be used more effectively since they can focus on predefined interference locations

The final step in the spectrum clearance process is eliminating interference sources which can be automated with a direction finding system, such as the R&S®MNT100 RF interference locator in combination with R&S®MobileLocator software.

The spectrum clearance solution consists of:

  • A network scanner (R&S®TSMA6B or R&S®TSME6)
  • The ROMES universal software platform for network optimization and troubleshooting
  • R&S®ROMES4NPA network problem analyzer software for postprocessing

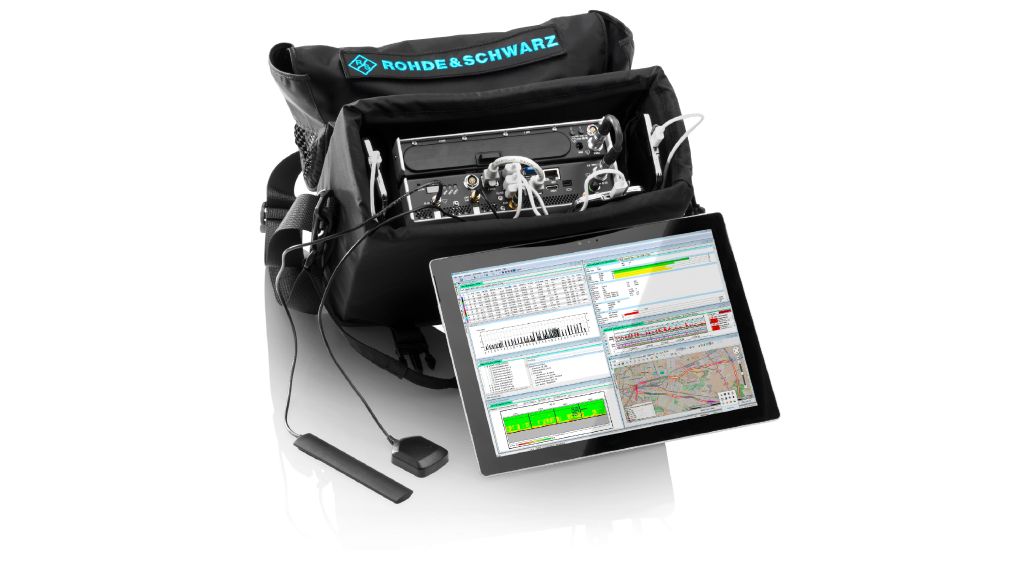
Below is a picture of the battery-powered R&S®TSMA6B autonomous network scanner that can fit neatly into a shoulder bag for comfortable drive or walk testing. The ROMES drive/walk test software runs on the next unit of computing (NUC) PC integrated into the R&S®TSMA6B. The software is supported by a GPS receiver and mapping capabilities. Measurements can be controlled with a tablet that displays results to the user in real time.

The portable spectrum cearance solution R&S®TSMA and R&S®ROMES4 drive/walk test software
The portable spectrum cearance solution: the R&S®TSMA autonomous mobile network scanner and the R&S®ROMES4 drive/walk test software
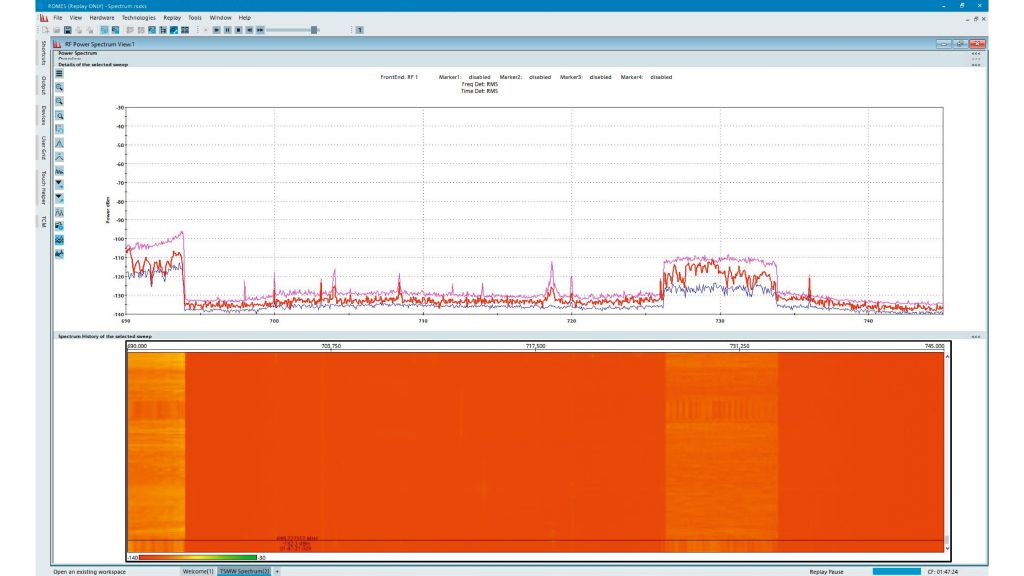
Spectral characteristics of the interference spot using ROMES
Spectral characteristics of the interference spot using ROMES drive test software
Open Lightbox

Benefits and key features

Connecting a network scanner to the analysis and postprocessing software in an integrated package makes test solutions from Rohde & Schwarz unique.

User benefits:

  • Accelerated spectrum clearance with automated interference identification
  • Experts can be used more efficiently by separating data collection and analysis
  • More reliable data collection by reducing the need for redrives, since predefined measurement setups can be distributed for high quality measurement results
  • A complete overview of the interference situation thanks an extremely sensitive scanner that quickly and clearly separates the clear parts of the spectrum from interference sources
  • Highly efficient data collection with very stable operation and drive test software that can handle large amounts of data
  • Easy analysis, setup and modification with the integrated postprocessing tool
  • Save time with fast analysis: two hours of drive test data can be typically analyzed in two to three minutes

Further analysis of the interference signals, clearly reveals a cluster in the range from 725 MHz to 735 MHz (see screenshot right).

The key solution features:

  • Central measurement control to distribute predefined measurement setups for high quality measurement results
  • Extremely sensitive scanner (can scan the complete 30 MHz uplink bandwidth with –130 dBm DANL) to quickly and precisely separate a clear spectrum from interference sources
  • Very fast scanner allows more data to be collected in each test period (or shorter measurement times for the same amount of data)
  • Proven drive test platform can handle large volumes of data
  • Fast automated and integrated postprocessing tool
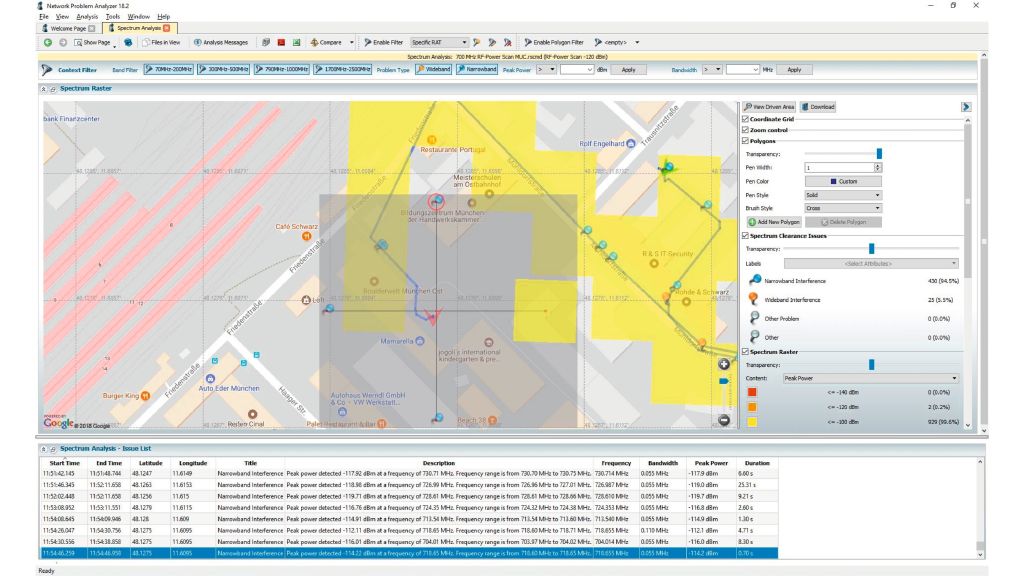
Result example from R&S®ROMES4NPA
Result example from R&S®ROMES4NPA: spectrum measurements in the 700 MHz band. The red circle in the image identifies one potential problem spot, which is highlighted in the Issue List.

Related solutions