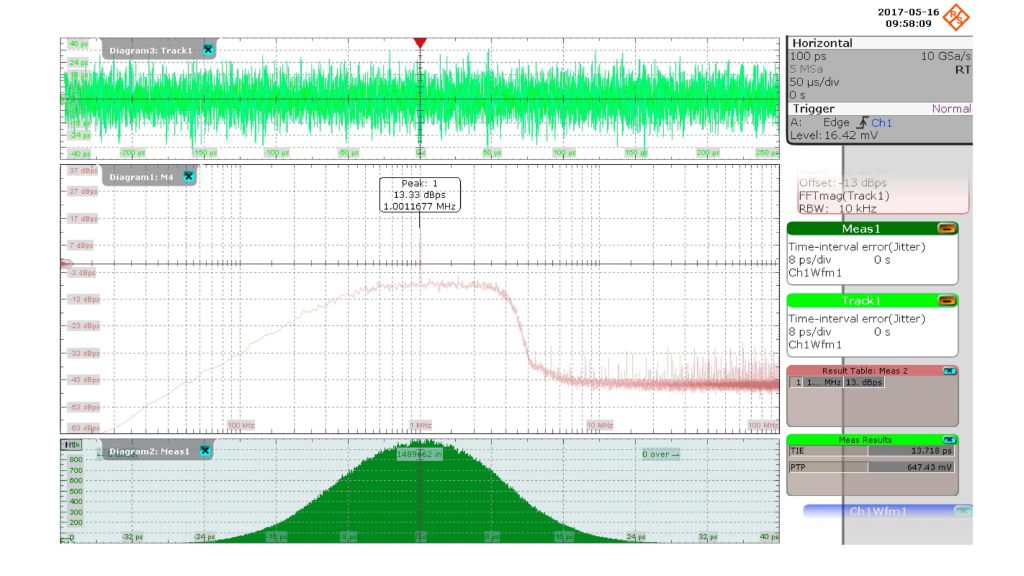
The top of Fig. 1 on next page shows the R&S®RTO measurement waveform as a track function (TIE versus time). The middle diagram shows the FFT of the track function. The FFT displays the jitter spectrum with the PJ. The area under the curve corresponds to the total jitter (TJ) of the signal. The results are displayed in dBps. At the bottom, the histogram of the TIE measurement is shown.
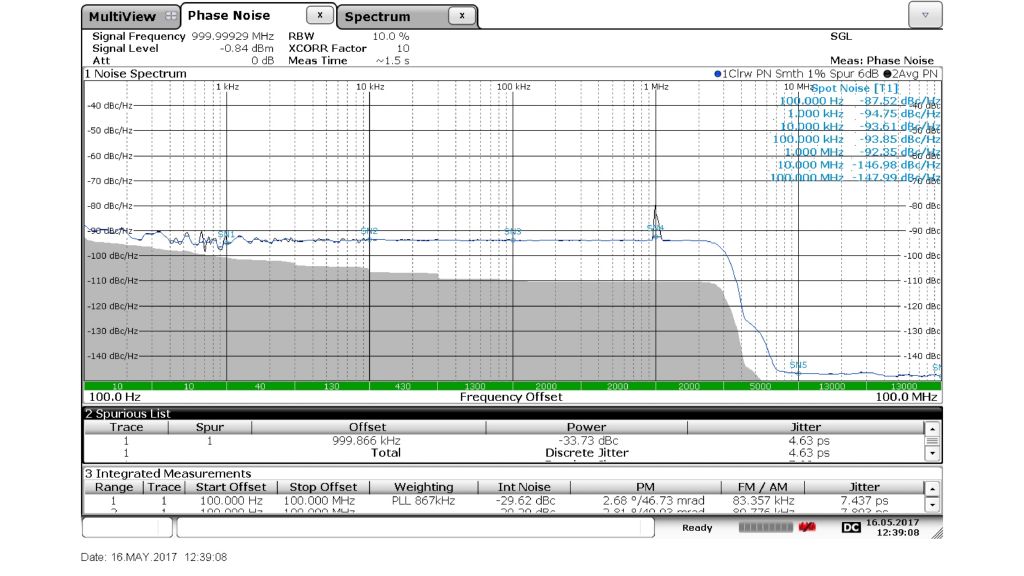
In Fig. 2, the R&S®FSWP measurement results are displayed in dBc (1 Hz). The R&S®FSWP also calculates the PJ of each spur, the total PJ and the RJ of the phase noise spectrum in ps.
To compare the results, the units of both measurements are converted to ps. In addition, the random jitter for the R&S®RTO and the total jitter for the R&S®FSWP are calculated using the following equation:
TJ2 = RJ2 + PJ2
The table on the next page shows the individual measurements and the differences. The R&S®RTO and R&S®FSWP results are nearly identical. They detect the PJ at the same frequencies, and the difference in their values is less than 0.5 ps. The difference between the detected RJ and TJ values is less than 0.5 ps. This good correspondence proves the comparability of the two instruments.


