Testing hopping radios with confidence
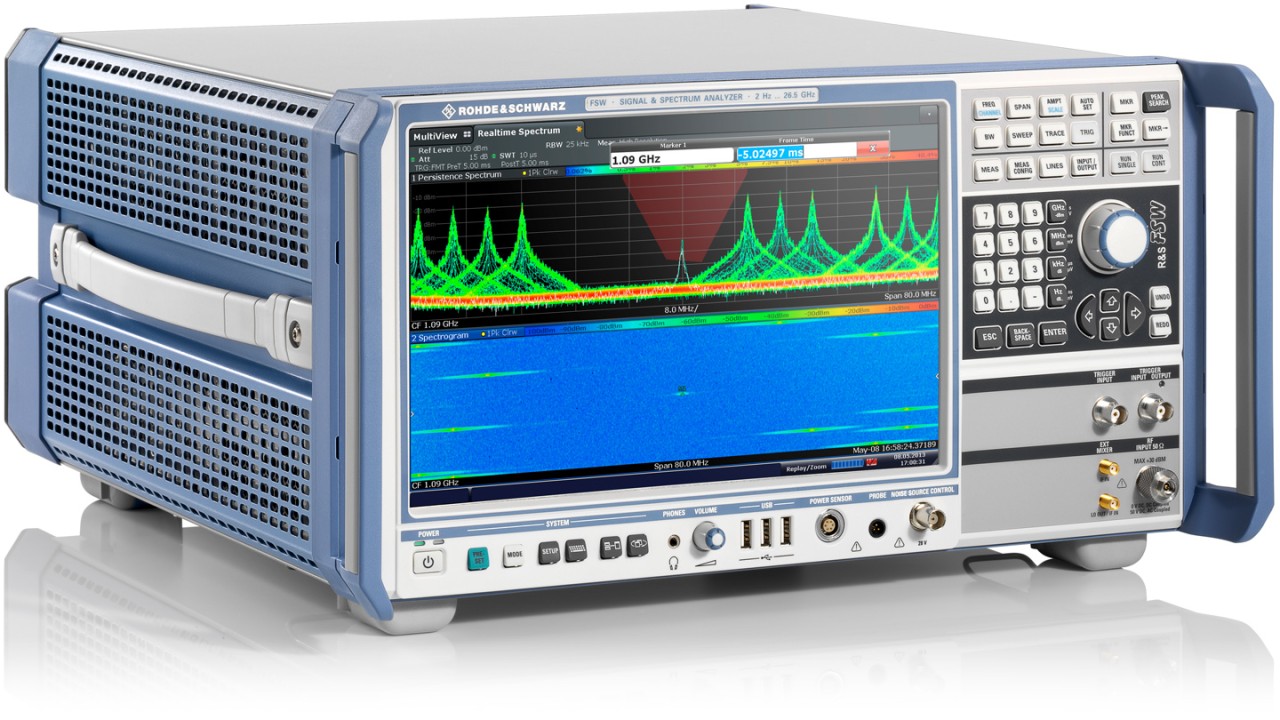
The R&S®FSW signal and spectrum analyzer with the R&S®FSW-K160R realtime option enables wideband signal analysis and high probability of intercept.

The R&S®FSW signal and spectrum analyzer with the R&S®FSW-K160R realtime option enables wideband signal analysis and high probability of intercept.

Many of today’s advanced tactical radios utilize frequency hopping techniques to mitigate potential interference and jamming threats during critical operation. While these radios are often operated in a static mode (non-hopping) for performance testing, it is also important to validate performance of the radios during all operational hopping modes to ensure that these radios do not interfere with adjacent signal bands or inband communications technologies. Unintentional signals can not only disrupt other radios on these networks, but also other wireless systems that might be collocated in the same spectrum. Sources of undesired spurs can occur due to transients and modulation errors, digital to RF coupling, nonlinear effects and power glitches, and even timing errors from hardware tuning and clock synchronization. These temporal spurious signals are difficult to detect using traditional test solutions due to the very fast nature of the signals.
One of the most sensitive bands of tactical radio communications is the aeronautical radio navigation services (ARNS) frequency band operating between 960 MHz and 1215 MHz. While this is a popular frequency band for tactical radio communications, especially in airborne radio platforms, it is also a critical frequency band for navigation and communications infrastructures.

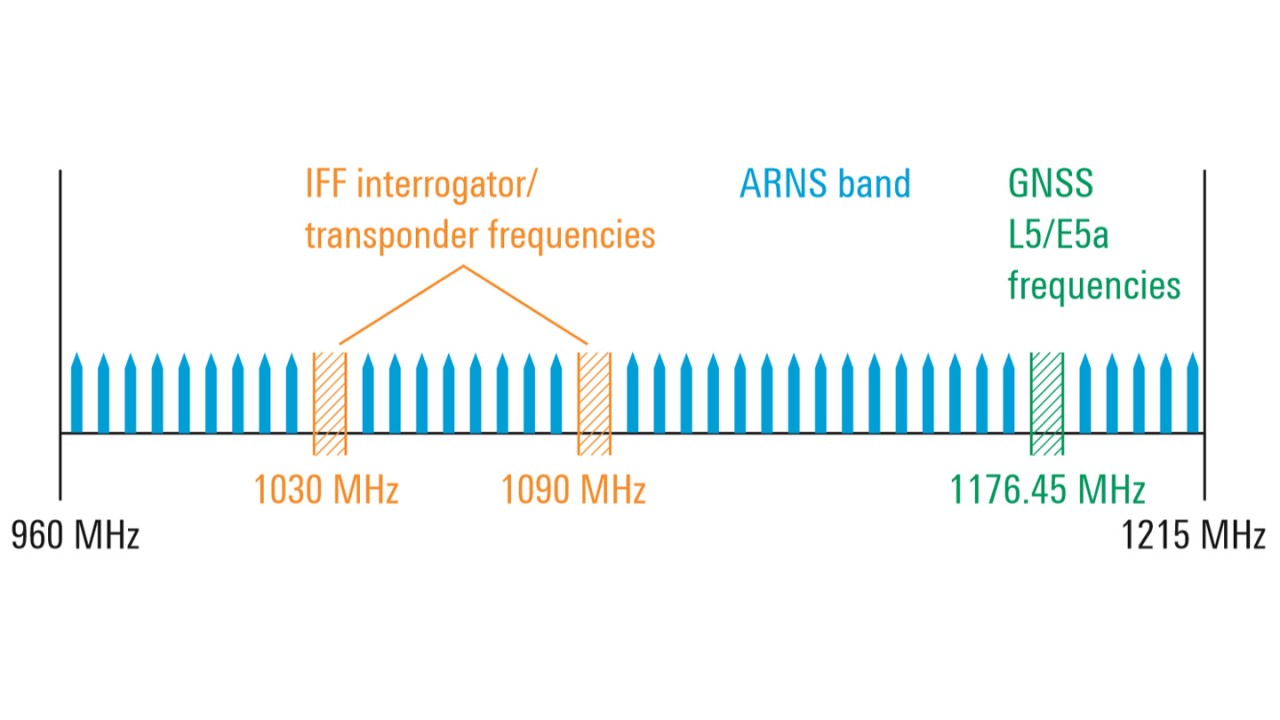
The figure above shows some of the critical wireless technologies that are collocated in the ARNS spectrum such as the IFF interrogator/transponder frequencies (1030 MHz and 1090 MHz) and the GNSS L5/E5a band at 1176.45 MHz. These critical navigation and radiolocation technologies can suffer performance degradation from unintentional spurious emissions of uncontrolled radios whose emissions violate the frequency guard bands.
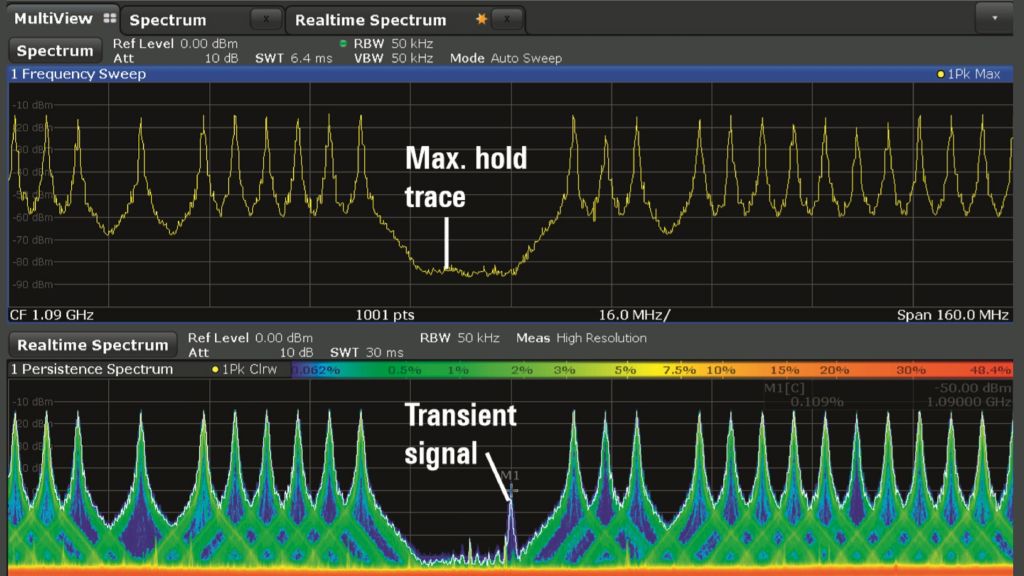
Comparison of a fast hopping radio signal displayed on the R&S®FSW in conventional spectrum analyzer mode (upper) with max. hold trace after several seconds and in realtime mode (lower).
Traditionally, conventional spectrum analyzers have been used for searching for unwanted inband or out-of-band spurious signals. Even with a spectrum analyzer like the R&S®FSW that has the highest dynamic range and fastest sweep capability of any commercially available spectrum analyzer, the architectural limitation of traditional swept analysis has a low probability of intercept (POI) for rapidly occurring transient signals.
Consider the signal conditions of a fast hopping radio signal emulation shown in the screenshot above. While trying to validate that unintentional signals do not violate the IFF band at 1090 MHz, the analyzer is set up in the sweep mode and captures signals in max. hold for several seconds as shown in the upper display of the screenshot above. The sweep time is 6.4 ms across 160 MHz at a 50 kHz resolution bandwidth. The lower display shows a color gradient scale of the persistence spectrum in the R&S®FSW-K160R realtime spectrum mode for the same frequency range. In this mode, the signal can be analyzed at up to 600 000 FFT/s yielding a 100 % probability of intercept for signals as fast as 1.87 μs in the same 160 MHz band. Notice that a signal is captured in the persistence spectrum display, but it is not visible with the max. hold trace in the conventional spectrum analyzer display. Eventually, the max. hold display should be able to capture the spurious signal at some amplitude if the spurious signal repeats. However the probability of signal occurrence would need to be considered when attempting to determine how long you would need to dwell on the signal to expect to capture the event.

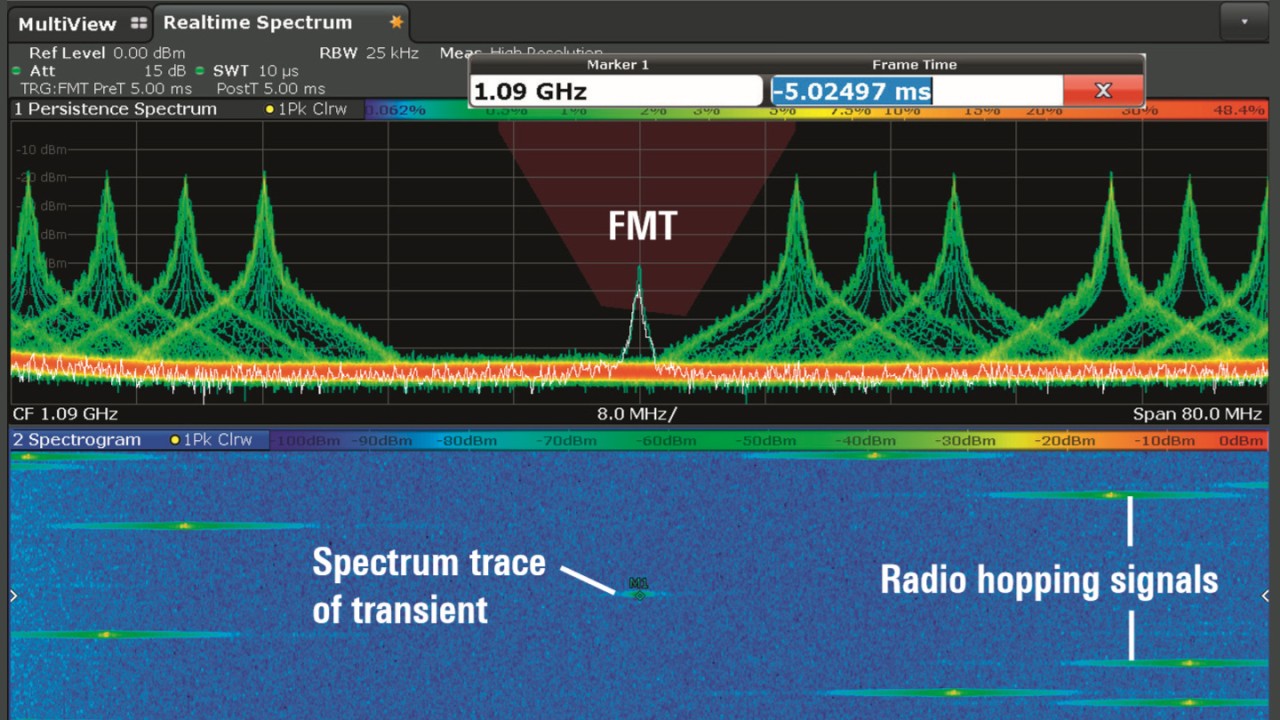
A frequency mask trigger (FMT) is added to the persistence spectrum display in realtime mode, enabling the acquisition and isolation of signal violations at 1090 MHz.
The realtime spectrum mode is essential for developers working on modern digital designs or frequency hopping issues, and for the detection of low probability of intercept signals such as transients. Realtime functions such as frequency mask triggering and realtime spectrogram display also enable isolation of signals and time correlated analysis so the user can troubleshoot the radio design. Once detected, root cause analysis is simplified with the availability of multiple analysis windows such as those shown in the screenshot below. The frequency mask trigger (FMT) in realtime mode enables immediate isolation of the signal. When combined with the spectrogram display, the time correlated analysis of the signal can assist with troubleshooting what was happening to the radio signal before, during, and after the event of interest.
Captured I/Q data can be analyzed within the entire analysis bandwidth of the R&S®FSW, and time-correlated views of the spectrum, timing, modulation, and statistical properties of the signal can be analyzed.
The R&S®FSW-K160R option is the latest addition to the Rohde & Schwarz realtime analysis portfolio. Integrated into the highest performance signal and spectrum analyzer platform, the R&S®FSW signal and spectrum analyzer, boasts industry leading performance for displayed average noise level (DANL), phase noise, and measurement bandwidth (320 MHz analysis bandwidth).
Designed for scalability, the new realtime function is a software option on the R&S®FSW that adds new industry benchmarks for performance with nearly 600 000 FFT/s and a 100 % POI of 1.87 μs at 160 MHz analysis bandwidth.