Power supply control loop response measurements (Bode plot)
With a Rohde & Schwarz oscilloscope

With a Rohde & Schwarz oscilloscope
Your task
To ensure the stability of voltage regulators and switchedmode power supplies, e.g. multiphase buck-converters, the control loop behavior must be measured and characterized. A well compensating voltage controller enables stable output voltages and reduces the influence of load changes and supply voltage variations. The quality of this control circuit determines the stability and dynamic response of the entire DC/DC converter.
Rohde & Schwarz solution
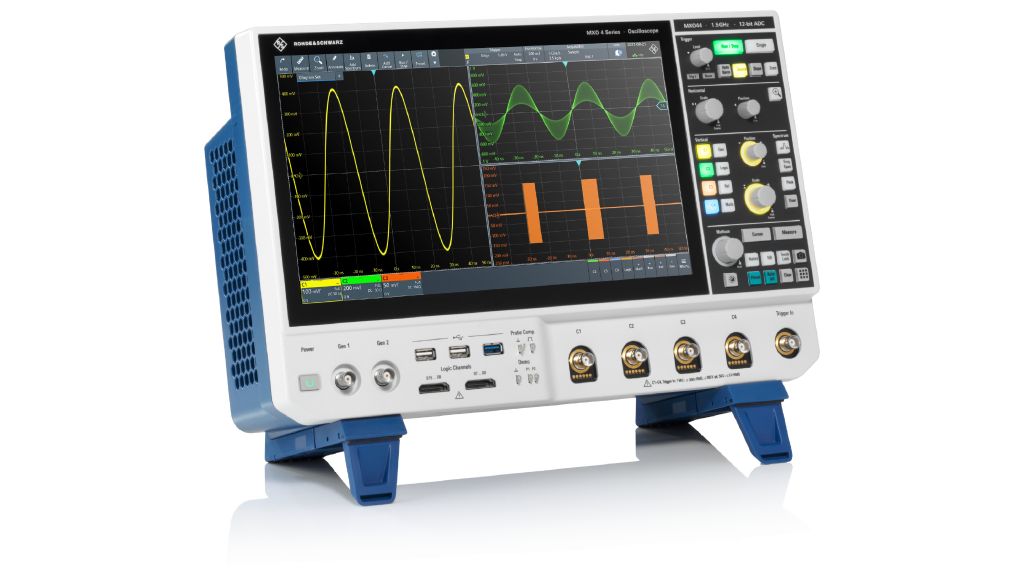
Easily and quickly analyze low frequency response on your oscilloscope with the R&S®MXOx-K36 frequency response analysis (Bode plot) option. Characterize the frequency response of a variety of electronics, including passive filters and amplifier circuits. Measure the control loop response and power supply rejection ratio of switched-mode power supplies. The R&S®MXOx-K36 frequency response analysis (Bode plot) option uses the oscilloscope’s built-in waveform generator to create stimulus signals ranging in frequency from 10 mHz to 100 MHz. Measuring the ratio of the DUT signal input and output at each test frequency, the oscilloscope plots gain logarithmically and phase linearly.
The R&S®MXOx-K36 frequency response analysis (Bode plot) option allows you to quickly determine the gain and phase margin of switched-mode power supplies or linear regulators. These measurements help determine the control loop stability.
The R&S®MXOx-K36 frequency response analysis (Bode plot) option displays the system response to changes in operating conditions, such as supply voltage changes or load current changes.
Measurement setup
Power supply control loops compare reference voltage (Vref) and feedback voltage (Vfeedback) and create a negative feedback to ensure a stable output voltage.
Control loop response testing requires injecting an error signal over a band of frequencies into the feedback path of the control loop. To inject an error signal, a small resistor must be inserted into the feedback loop. The 5 Ω injection resistor shown in the graphic Choosing the correct injection point on the next page is insignificant in comparison to the series impedance of R1 and R2. Some users choose to permanently design in this low-value injection resistor (Rinjection) for test purposes. An injection transformer, such as Picotest’s J2100A, isolates the AC distortion signal and eliminates any DC bias.
Injection point and probing
To measure the loop gain of a voltage feedback loop, the loop needs to be broken at a suitable point. A distortion signal is injected at this point. The distortion signal will be distributed in the loop circuit. Depending on the loop gain, the injected distortion signal will be amplified or attenuated and shifted in phase. For the R&S®MXOx-K36 option, the generator of the oscilloscope generates the distortion signal. The oscilloscope measures the transfer function of the loop.
To ensure that the measured loop gain equals the real loop gain, choose a suitable point:
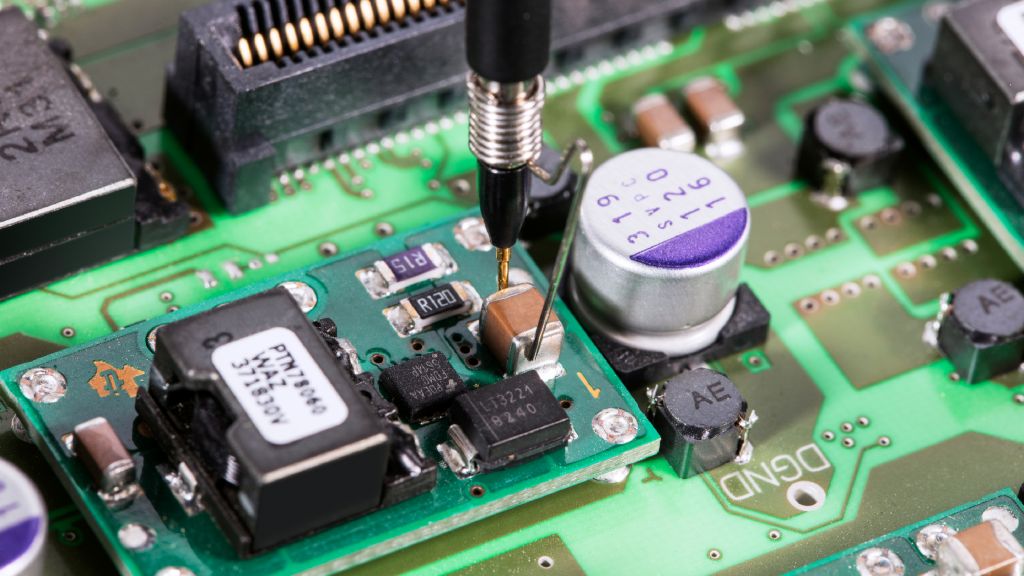
Using a ground spring will provide the best signal-to-noise ratio for your power supply rejection ratio measurement
Accurate control loop response characterization depends on good probing. Peak-to-peak amplitudes of both Vin and Vout can be very low at some test frequencies. These values would be buried either in the oscilloscope’s noise floor and/or in the switching noise of the DUT itself. This is why increasing the SNR of your measurements will significantly improve the dynamic range of your frequency response measurements. Most oscilloscopes usually come with 10:1 passive probes that have more noise. Using lownoise 1:1 passive probes will reduce measurement noise and improve SNR. Rohde & Schwarz recommends the R&S®RT‑ZP1X 1:1 passive probes with 38 MHz bandwidth for this application.
Reducing the length of your probe’s ground connection minimizes inductive ground loops. The standard ground lead of your probe can sometimes act as an antenna and amplify unwanted switching noise. Find a ground post near the Vin and Vout test points.
Use the provided ground spring of the R&S®RT-ZP1X probe to shorten the ground connection. This will provide a good low-noise ground for your measurement.
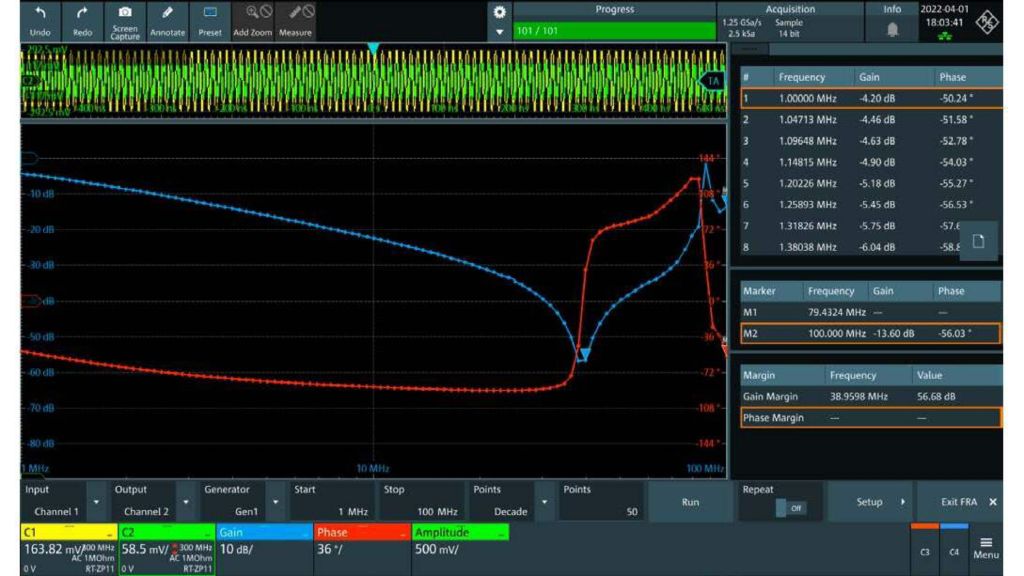
Measurement of the stability of a DC/DC converter (blue trace: gain; red: phase). The tables on the right indicate the amplitude profile, as well as the marker and margin measurement results.
Device setup
After connecting the oscilloscope to the circuit under test, start the application:
Measurement results
The Bode plot diagrams represent the circuit transmission function and help verify system stability by displaying the amplitude behavior (in dB) as well as the phase characteristics (in degrees) versus input frequency. Individual markers can be directly set to the desired positions on the plotted trace, along with a legend displaying the marker coordinates. To determine the crossover frequency, set one marker to 0 dB and the second marker to –180° phase shift. Now you can easily determine the phase and gain margin.
The measurement results table provides detailed information about each measured point (frequency, gain and phase shift). When using markers, the associated row of the result table is highlighted. For reporting, quickly save screenshots, table results or both to a USB device.
Oscilloscopes are the primary measurement tools used today by engineers to test and characterize their power supply designs. The R&S®MXOx-K36 frequency response analysis (Bode plot) option provides a low-budget alternative to low frequency network analyzers or dedicated standalone frequency analyzers.