Two-channel measurement of range gate pull-off jamming
Using R&S®RTP high-performance oscilloscopes and R&S®VSE-K6A phased array measurement option

Using R&S®RTP high-performance oscilloscopes and R&S®VSE-K6A phased array measurement option


The jammer gradually increases the power of the jamming cover pulse to capture the AGC.
Jamming works by increasing the power ratio of a jammer relative to a victim radar. Deceptive jamming is an improved form that uses the following process to gradually increase the jamming to signal ratio (J/S) over a victim radar to infinity. First, it captures the victim radar’s range and velocity gate (or both) by progressively increasing the power of the jamming pulse over the target return measured in the victim radar. This results in the radar adjusting its automatic gain control (AGC) to the power level of the jamming pulses, also known as cover pulses.


As the jammer increases the cover pulse delay to pull the radar to a later range gate, J/S becomes infinite.
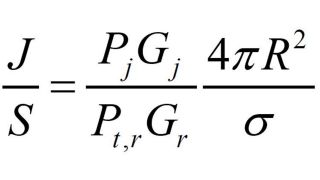
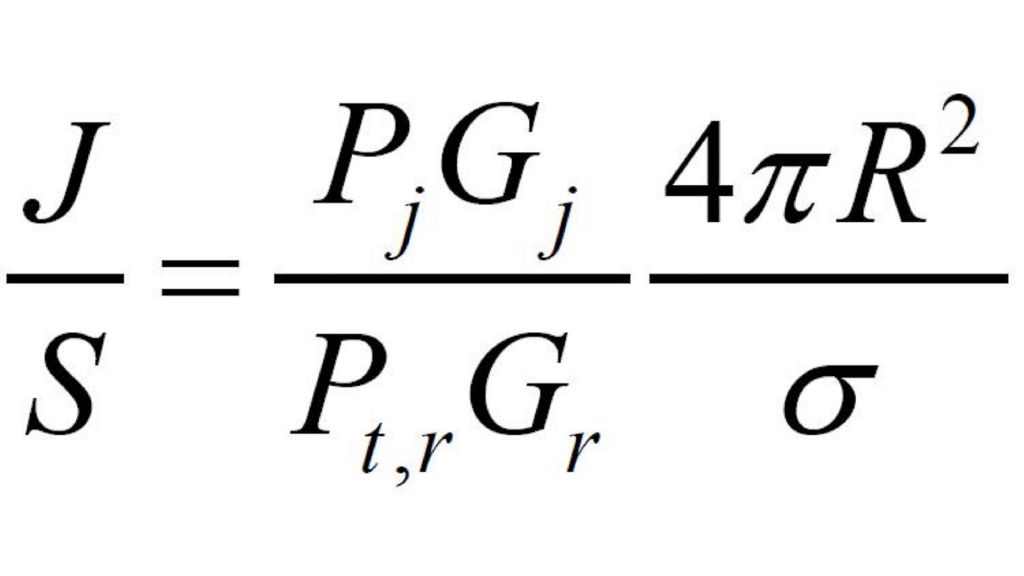
After capturing the AGC, the jammer begins to change the frequency and delay of the jamming pulses to differ its range and velocity (Doppler) from those of the jamming aircraft. As the victim radar is “walked-off” from the jamming aircraft range and velocity gates, the J/S is infinite since the victim radar is no longer measuring any target return from the jamming aircraft. This can be seen in the J/S equation for a deceptive, selfprotection jamming against coherent radar, derived from Neri1):


Where Pj and Gj are the power and gain of the jammer, Pt,r and Gr are the transmitted power and gain of the victim radar, σ is the radar cross section (RCS) of the jamming aircraft, and R is the distance between the jammer and the victim radar. As the victim radar is pulled to a range or Doppler gate other than the one for the jamming aircraft, the RCS goes to zero and the denominator of the equation will fall to zero increasing the J/S to infinity.
Verifying deceptive jamming techniques at RF requires a two-channel measurement receiver for both power and time. The first channel measures the victim radar usually simulated by a signal generator during testing. The second channel measures the jamming technique. Correlation measurements across both channels demonstrate when J/S is achieved and when it becomes infinite.
An oscilloscope is the ideal receiver for a two-channel comparison measurement and the gold standard for timing measurements. The test setup consists of the R&S®SMW200A vector signal generator to simulate the victim radar and induce a jamming response in the jammer and the R&S®RTP high-performance oscilloscope to measure and compare the victim radar and jamming response. Measurements can be made using both the oscilloscope application and the R&S®VSE vector signal explorer software running the R&S®VSE-K6A phased array measurement option.


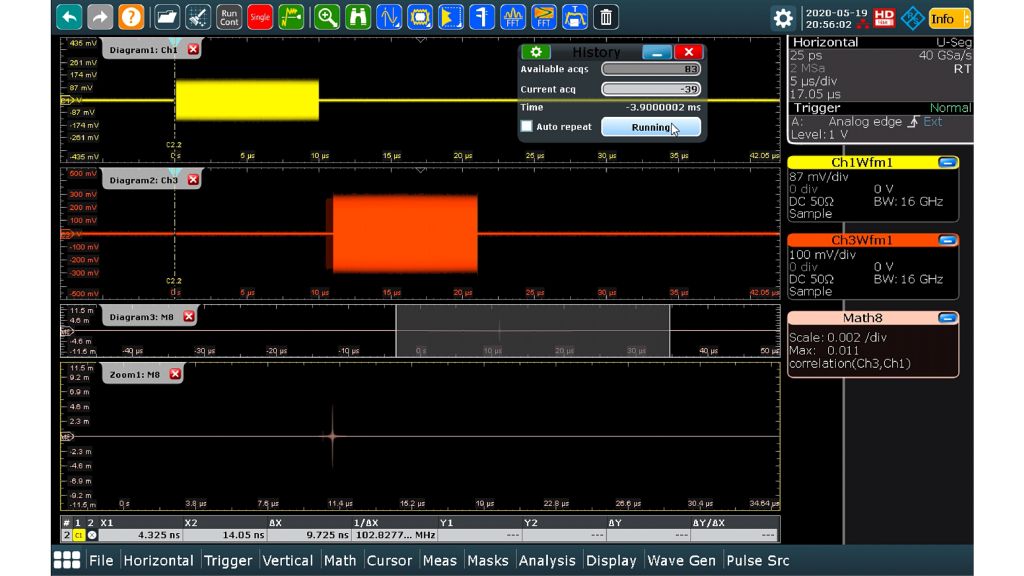
RGPO measurement with oscilloscope: the correlation function measures the delay between the jamming technique and the victim radar. As delay exceeds the range bin of the jamming aircraft, J/S becomes infinite.
To measure range gate pull-off (RGPO) using the base oscilloscope application, trigger both channels on the first pulse of the victim radar (trigger setup is explained below). Lengthen the timebase of the oscilloscope to include the full extent of the pull-off. In other words, if the total pulloff against the victim radar is 50 μs, make 50 μs the time base. Use the fast segmentation feature with enough segments to capture the technique and then review it with the History. An added cross-channel correlation measurement can precisely identify the time offset between each pulse at each moment.
RF pulses can also be measured using the R&S®VSE vector signal explorer software with the R&S®VSE-K6A phased array measurement option. The software and option have built-in pulse measurements that include pulse width, pulse amplitude, pulse repetition interval and pulse frequency and can be difficult to configure on the base oscilloscope application. When measuring two RF channels at once, as is the case with the RGPO measurement, the R&S®VSE-K6A option enables electronic warfare (EW) engineers to automate jamming technique measurements and know their precise relative timing and amplitude.
Measure RGPO by activating a pulse measurement channel on the R&S®VSE and connecting it to the R&S®RTP high-performance oscilloscope. First, configure triggering on the victim radar pulse. Under the trigger menu, set the R&S®VSE trigger to Manual.
Under Info & Settings in the R&S®VSE instrument window, make sure Display Update is on.
Press Local on the front panel of the oscilloscope or in the browser VPN connection.
On the oscilloscope, set an edge trigger in the oscilloscope channel measuring the victim radar. Channel 1 is used in this example. Make sure the trigger level is set far enough above the oscilloscope noise floor to prevent noise from triggering a measurement.
Add a holdoff to the edge trigger that is slightly longer than the victim radar pulse. In this case, the pulse width of the victim radar is 10 μs. Finally, set the trigger mode to Normal so that the instrument acquires a waveform or set of waveform segments when all trigger conditions are fulfilled.
Return to the R&S®VSE and configure the data acquisition filter and sample rate. When measuring pulse power and modulation, use the Flat acquisition filter instead of the Gaussian filter, since the pulses are already self-windowing and the Gaussian filter will distort the modulation spectrum. Set this under Meas Setup ▷ Data Acquisition ▷ Filter Type. If measuring modulation-on-pulse, match the sample rate to the modulation bandwidth. Be aware that widening the measurement bandwidth also increases the noise bandwidth and degrades measurement signal-tonoise ratio (SNR). This can be improved by increasing the signal power.
Now configure the segmented capture. As with the base oscilloscope application, make the segment long enough to capture the entire walk-off relative to the trigger pulse of the victim radar.
Next, configure the displays. Click the pulse magnitude display then configure the result range so that the reference point is “rise,” the result range is “rise” and the length is 50 μs, i.e. the segment length.
Close this dialog and add a second trace to the Pulse Magnitude using channel 3: This will enable us to see the entire segment and watch the jammer pulse “walk-off” relative to the victim radar pulse.
Next, click the Pulse Results table and configure it under the Table Config tab. Turn on the Timing column so that the time difference between the victim radar and jamming pulses is shown in the Pulse Results table display and can be postprocessed in the following step.
The final step is to click the Capture button and wait for the victim radar to trigger the scope to capture segments.
After capture, the pulse measurements shown below display the captured segments. Each segment can be viewed by scrolling through the Pulse Results table (top right). The example shows segment 52 from oscilloscope channels 1 and 3. The Pulse Magnitude display (bottom) shows the victim radar pulse (yellow) and the jamming pulse (blue). The jamming pulse has more power and is delayed relative to the victim radar.
RGPO measurements can be automated by exporting the data to a spreadsheet and running a Visual Basic subroutine that calculates the difference in time stamps or pulse amplitudes between pulses in channels 1 and 3.
The results are shown in the RGPO column. The same code can be used to calculate the amplitude or frequency difference between the victim radar the jammer.
The R&S®VSE-K6A phased array measurement application features built-in, multichannel RF pulse measurements up to 16 GHz using the R&S®RTP high-performance oscilloscope. It is a powerful tool for analyzing deceptive jamming techniques such as range gate pull-off and for automating jammer testing.