Mobile network infrastructure testing from design to production
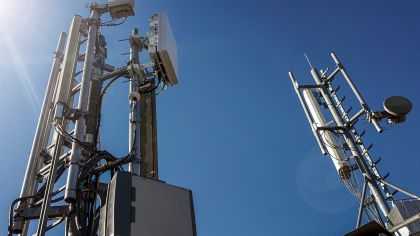
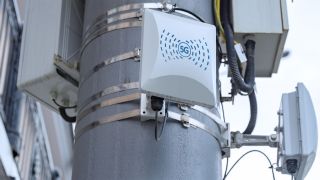
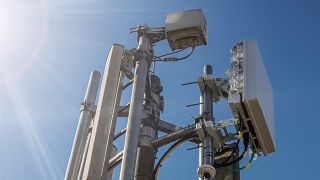
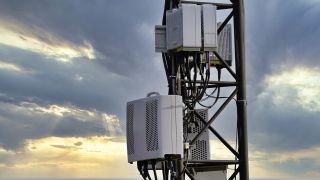
Radio access network (RAN) landscapes deploy different kinds of infrastructure equipment. They range from macro to small cell base stations and include distributed antenna systems, repeaters, active antennas, radios and mobile backhaul. Constantly developing technology up to 5G, new use cases and the ever-present demand for economic efficiency are drivers of the mobile network equipment industry.
Particularly 5G New Radio challenges infrastructure equipment testing due to increasing MIMO complexity and beamforming, wider bandwidths and new spectrum bands up to mmWave. The ever-increasing diversification and complexity of mobile network infrastructure equipment is often combined with demands such as cost efficiency and fast time-to-market. These requirements need to be reflected in innovative and flexible test and measurement solutions.
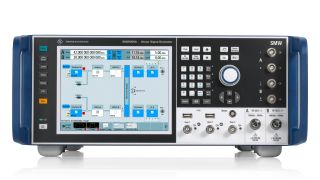
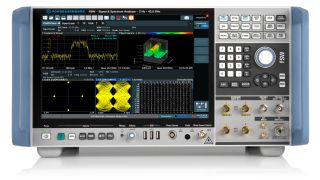
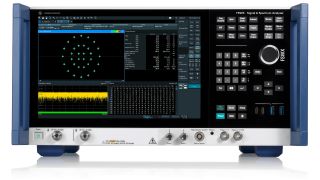
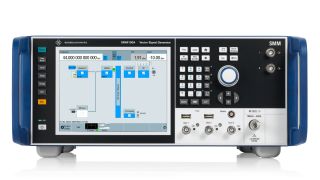
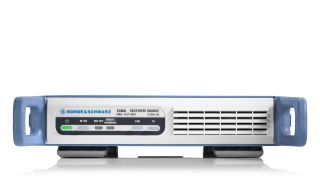
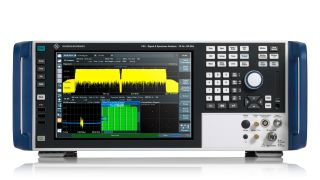
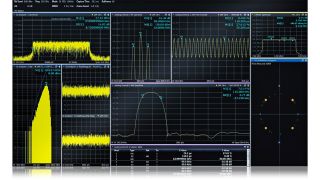
Rohde & Schwarz offers class-leading mobile network infrastructure testing solutions to address these various needs and to enable leveraging the opportunities of 5G. Our solutions portfolio covers all phases of the product life cycle, from R&D of RF and digital designs, design validation and integration to 3GPP defined base station conformance testing and production testing.


