EMC test challenges and solutions
Now that you understand the fundamentals of EMC testing, we can go over some challenges and how to address them with EMC test solutions.
Key challenges in EMC testing include shorter standardization cycles and limited testing resources.
This drives the need for faster test times and higher automation. Fast Fourier transform (FFT) or time domain scan testing has become the default test method for prototype precompliance testing as well as final compliance testing. Time domain-measuring test receivers, such as the
R&S®ESW
, can significantly increase test speed and reliability.
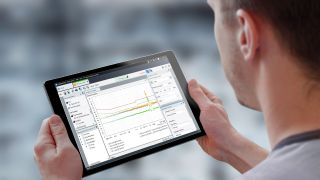
Higher automation can be achieved by using a software solution like R&S®ELEKTRA, which offers many benefits during:
- Test planning: setup, templates
- Test execution: instrument control, automation
- Analysis and reporting: customized charts, adding multiple tests to report
If you are planning on setting up your own in-house EMC test facility, it is important to balance your ambitions with available budget. Consider:
- Current and future testing needs
- Location requirements (like power line filters, electricity, fire protection, etc.)
- EUT weight and sizes, which determine chamber dimensions
- Availability of trained personnel
- Cost of calibration, service and maintenance
- Scalability and possibility of future upgrades or expansions
As an EMC test leader for over 50 years, Rohde & Schwarz has a long history of providing test and measurement expertise to EMC standard organizations - and we use our insider knowledge to develop test equipment that support EMC standards across all industries. We supply test equipment, systems, software, upgrades, turnkey solutions (including chambers), trainings, calibration and service. We are a trusted EMC test solution and service partner, guiding you through the process of creating solutions that fit your needs today and meet the demands of tomorrow.
For more information please contact us.


