Application Notes

Characterizing the material properties of polymers for radomes and bumpers to optimize radar transparency

Autonomous and semi-autonomous vehicles rely on a complex hardware and software architecture to gather and exploit information from numerous radar sensors. To generate reliable data, the sensors require an unobstructed view of the surroundings. The bumpers or radomes mounted in front of the sensors must not impair radar functionality. This requires extensive testing of the deployed plastic parts and their underlying polymer structure. The R&S®QAR50 is the ideal tool to characterize the material properties of polymers and their influence on the quality of the radar signal at an early design stage and in quality control of material development.

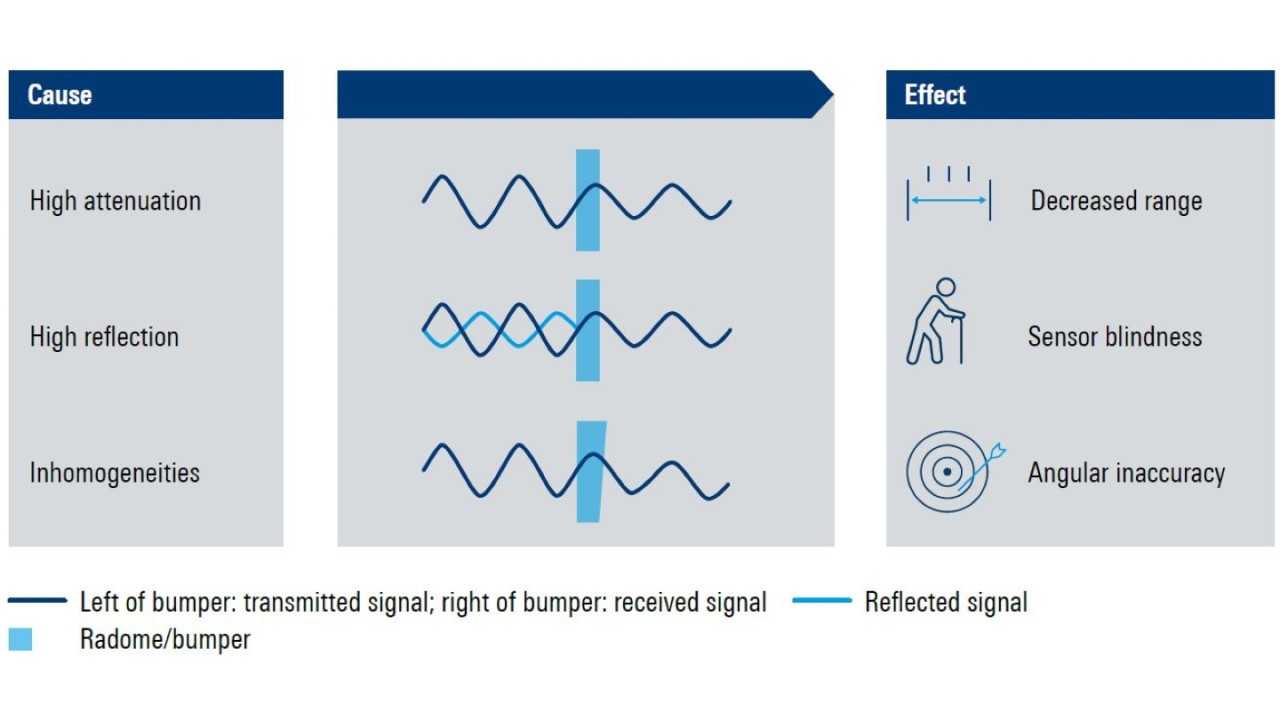
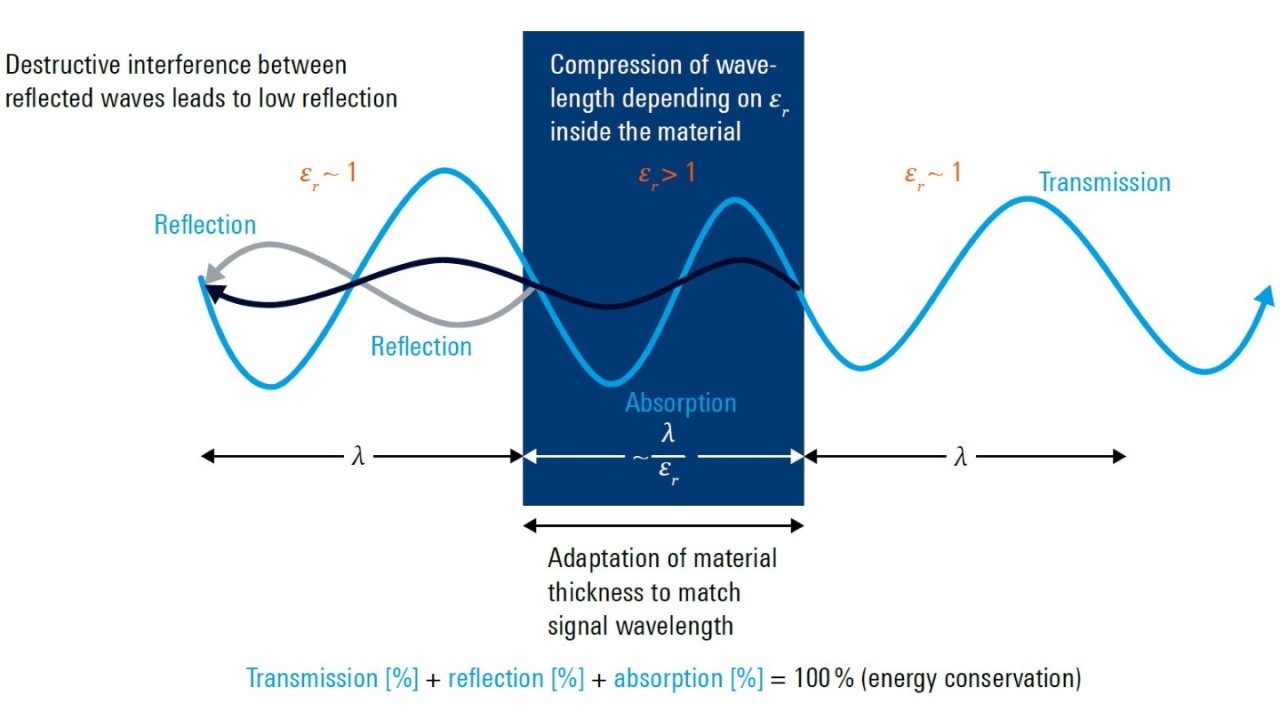
Fig. 1: Influence of polymer properties on radar performance
Open Lightbox

Your task

Application

The challenges to optimize the composition of polymers for bumpers and radomes are multifaceted. For example, the material must allow the right balance of lightweight construction, appearance, functionality and freedom of design. With the increasing use of radars in cars, the material properties of polymers used for bumpers and radomes are becoming a key factor in the overall radar performance, giving rise to new requirements. Reflections and mismatch of the material cause reflections between the radar and bumper/radome, leading to sensor blindness and ghost targets. Thus, the composition of polymers used on the exterior of the automobile must be optimized for radar transparency right from the start (see Fig. 1). Better choices can be made knowing how a polymer reflects, lets pass and/or absorbs radio frequency energy in the automotive radar range.

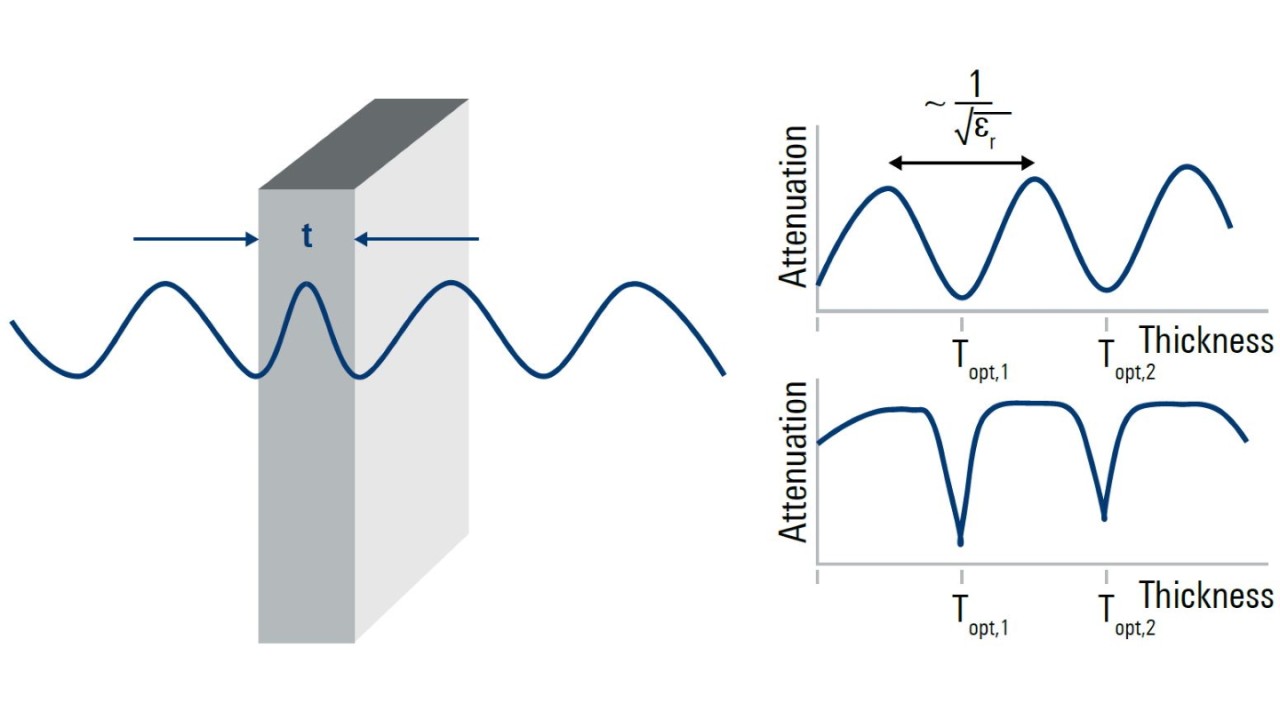
Typically, measurements primarily characterize the permittivity of a material. Permittivity, in simple terms, determines the wavelength compression of a transmitted signal within a material. Ideal material thickness always results in a multiple of half the wavelength within the material. The reason for this is cancellation of reflections by destructive interference occurring at the transitions between air and material and material and air.

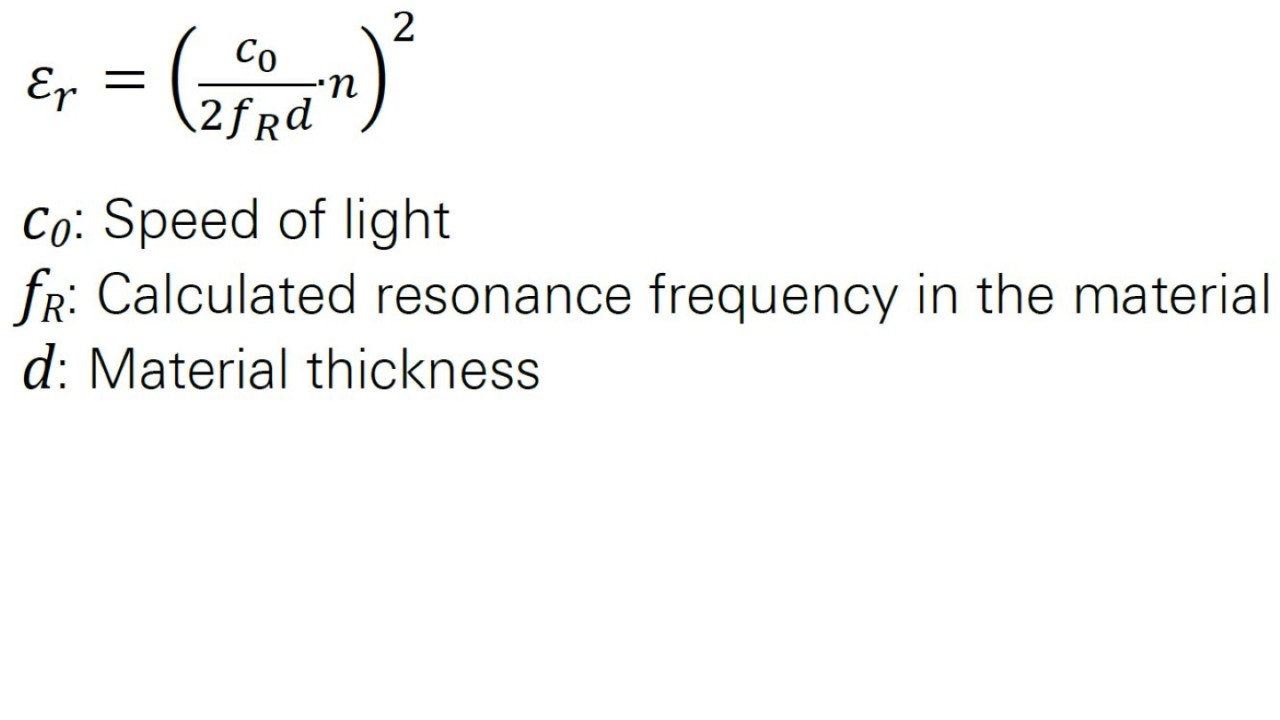
To determine the relative permittivity (εr), the electrical thickness of the material sample must be known. εr can be determined after calculating the resonance frequency.

Determine the relative permittivity (εr)

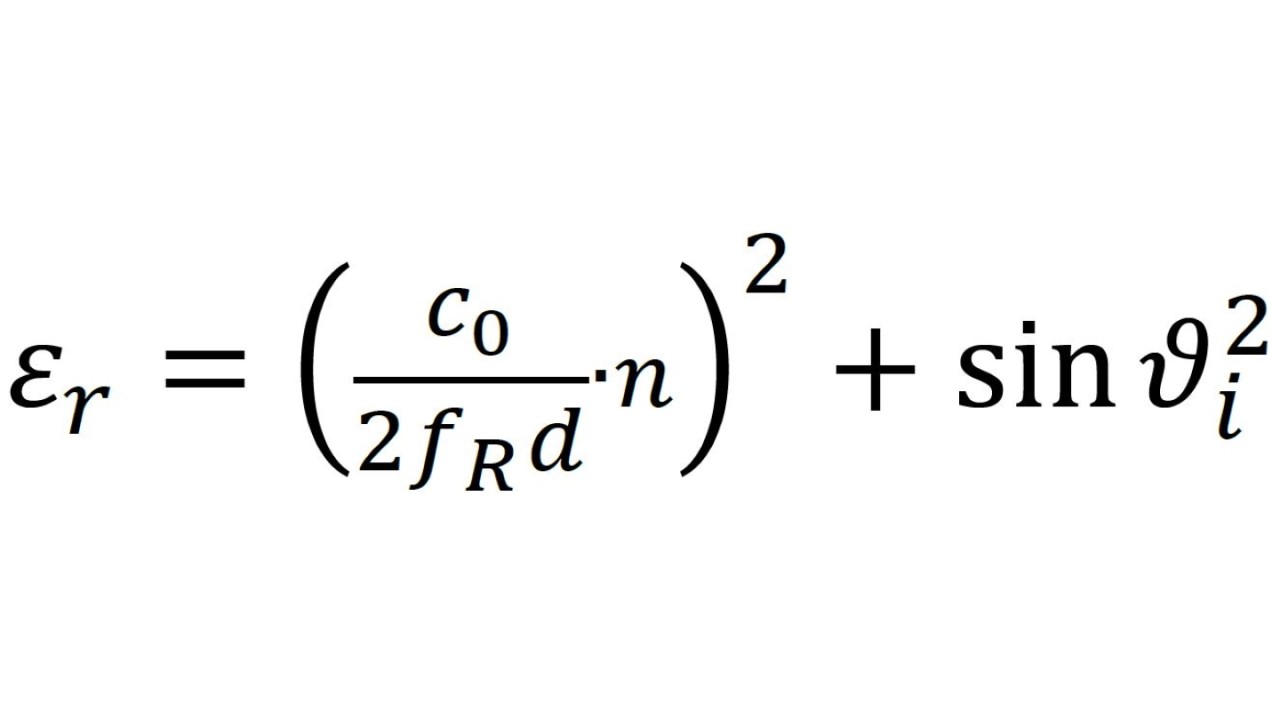
Due to the different angles of incidence of the radar signal, a correction term needs to be included in the above formula. The relative permittivity is thus determined by:

Relative permittivity

The average angle of incidence expressed by ϑi is included in the correction term. It represents the number of half wavelengths in the material.

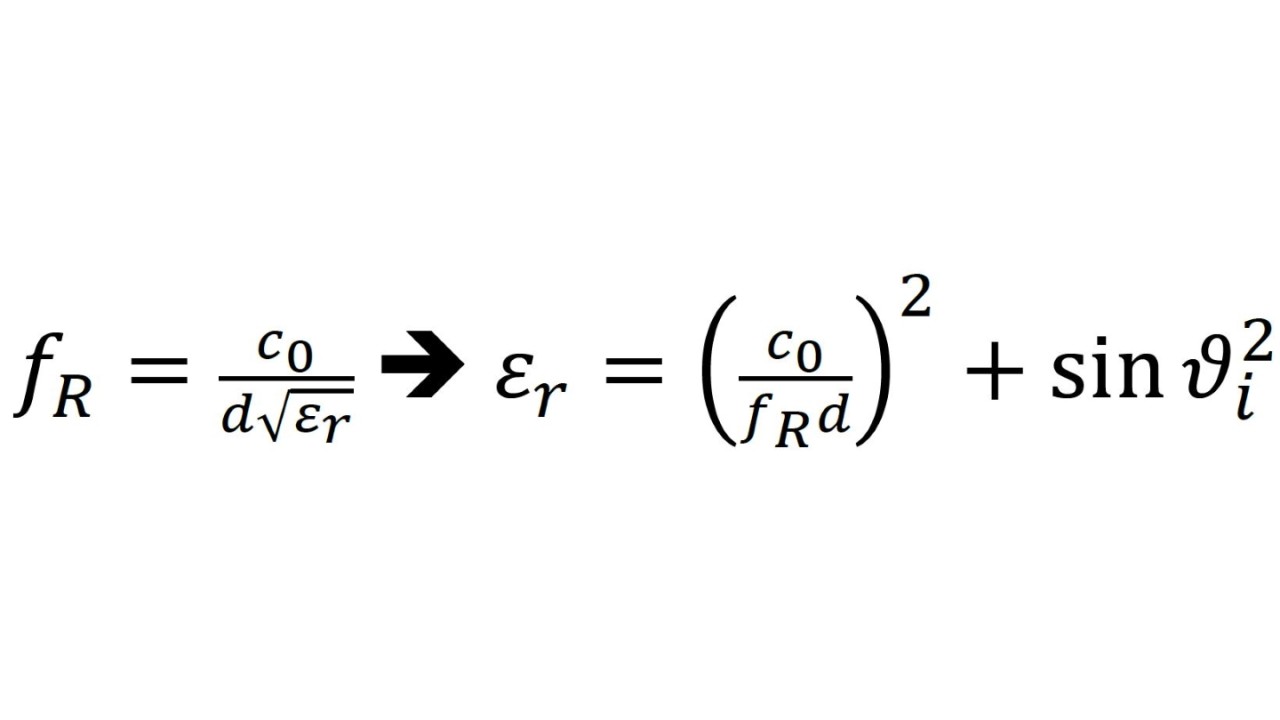
Assuming an electrical sample thickness of 2λ, the relative permittivity is obtained as follows:

Relative permittivity
Fig. 2: Influence of polymers on radar signal transmission and reflection
Open Lightbox

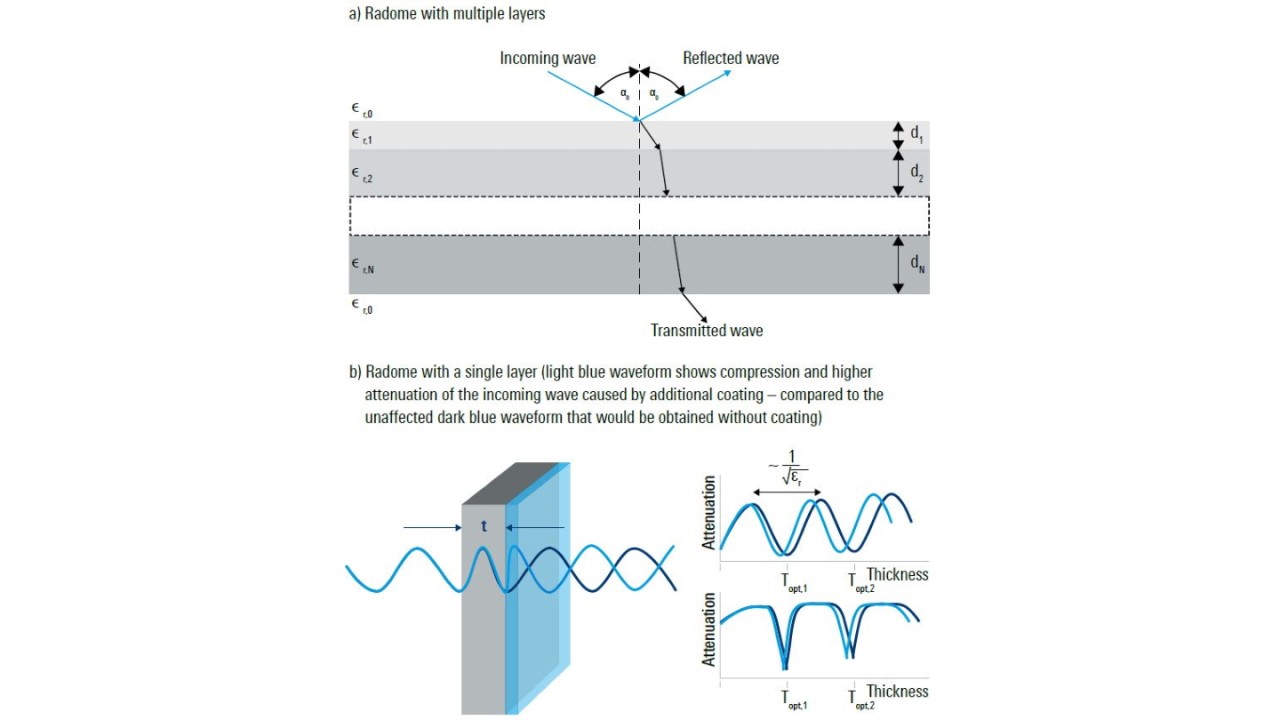
The εr value and the sharpness of the reflection and transmission loss minima can be optimized by material manufacturers. This requires the continual determination of permittivity during development as well as resolving the reflection and transmission loss minima. This standardized procedure also allows the influence of multilayer systems, such as paintwork, to be optimized in an iterative process to avoid negative interactions between the radar and bumper/radome at an early stage in development (see Fig. 2).

Fig. 3: Influence of material thickness on reflection and transmission loss for single-layer radomes
Open Lightbox
Fig. 4: Interpreting transmission loss measurements for single- and multilayer radomes
Open Lightbox

Challenge

The most basic kind of material characterization is using a sheet of dielectric material with thickness d and permittivity εr. More complex types of characterization involve multilayer materials with different thickness and material parameters, e.g. polymers, absorbers, foam or paint. Here, the complexity of the overall characterization increases significantly due to the thickness of the individual layers and possible air gaps (see Figs 3 and 4).

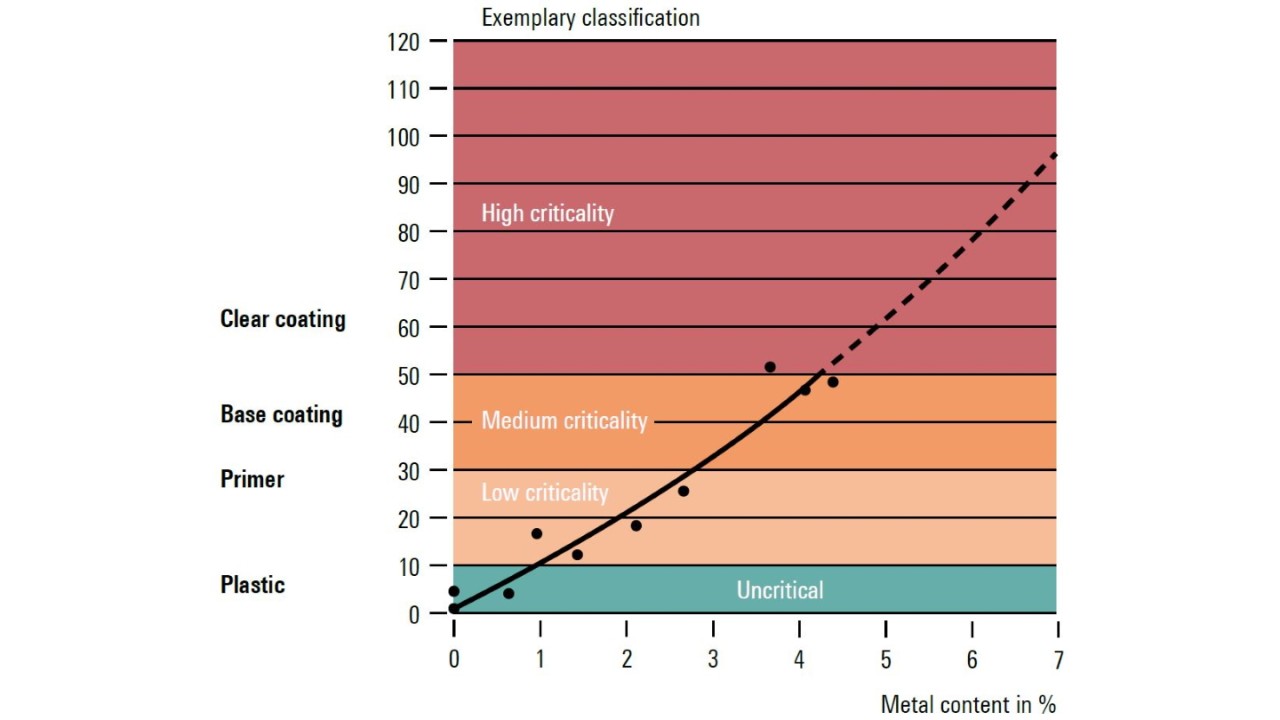
Fig. 5: Influences of paint and coatings on the material thickness of a bumper
Open Lightbox

Metallic paints in particular have the potential of adding various uncertainty factors. Metal pigments act as conductors with electrons that are separated by isolators. Electromagnetic waves cause the electrons to oscillate inside the metal, polarizing the surface and strongly increasing permittivity (see Fig. 5).

Since all of these steps need to be repeated in quick succession, a simple measurement method is required that delivers robust and reliable results. Here, using RF signals to perform material measurements has a number of important advantages. First, and perhaps most importantly, this approach allows for nondestructive material testing. In many cases, we would like to obtain information about a material without destroying it in the process. Another important advantage is that RF signals allow material measurements to be made while the material is undergoing various physical, mechanical, thermal or chemical changes. The approach using RF signals to make material measurements focuses on determining the relative permittivity of a material.

One way of obtaining the relative permittivity is using a vector network analyzer (VNA). The VNA measures transmission and reflection as described in the following. For further details, refer to the document referenced on page 5 of this application card.

One approach taken for nondestructive testing is the freespace method as it is suitable for the 76 GHz high frequency radar band. This requires the VNA system, including a calibration kit, to work in that frequency range. The setup is complex and requires detailed VNA knowledge to achieve accurate and reproducible results. Vector network analyzers perform measurements at selected points, which means that the slightest deviation in angle has a massive effect on measurement values. Another limitation is that material samples need to be relatively large and flat in order to be properly illuminated by the antennas.

Rohde & Schwarz solution

To address the growing importance of characterizing the material properties of polymers used for exterior vehicle components, Rohde & Schwarz has developed the R&S®QAR50 quality automotive radome tester.

The R&S®QAR50 is the ideal tool for accurately testing the quality of radomes and bumpers in the automotive radar frequency range during all product phases from R&D to end-of-line (EOL) testing in production. It uses hundreds of receive and transmit antennas to quickly characterize materials, radomes and bumpers. The microwave imaging technology with its electronic focusing allows more flexible positioning of the DUT. The R&S®QAR50 comes with two clusters of antennas and customizable frequency bands. It measures one-way transmission loss, reflection on both sides (relative to the upper and lower cluster) and transmission phase – all within a measurement cycle of less than 4 s. Results are directly comparable to those obtained with free-space measurements using a vector network analyzer (see table).

Conventional approach Rohde & Schwarz approach
Requires:
  • Vector network analyzer
  • 2 × E-band frequency converter
  • 2 × horn antenna
  • RF cables
  • Calibration kit
Requires:
  • R&S®QAR50 quality automotive radome tester
  • R&S®QAR50-Z44 verification set (traceable to national standards)
High price and complex RF measurement equipment Cost-effective and easy to use
Complex measurement procedure with long calibration and measurement times Measurement results in less than 4 s
Requires trained RF engineer Requires no previous RF knowledge
Suitable for R&D Suitable for R&D and production

Measurement setup

The procedure for material characterization comprises the following steps:

  • Measure physical thickness d
  • Place sample inside the R&S®QAR50
  • Perform measurement
  • Calculate relative permittivity εr using a MATLAB® script (easy automation possible)

When investigating the influence of a coating or primer on the transmission and reflection properties of the sample under test, both variables can be significantly worsened by the addition of a top coat. For this reason, we also recommend taking measurements in the final painted state.

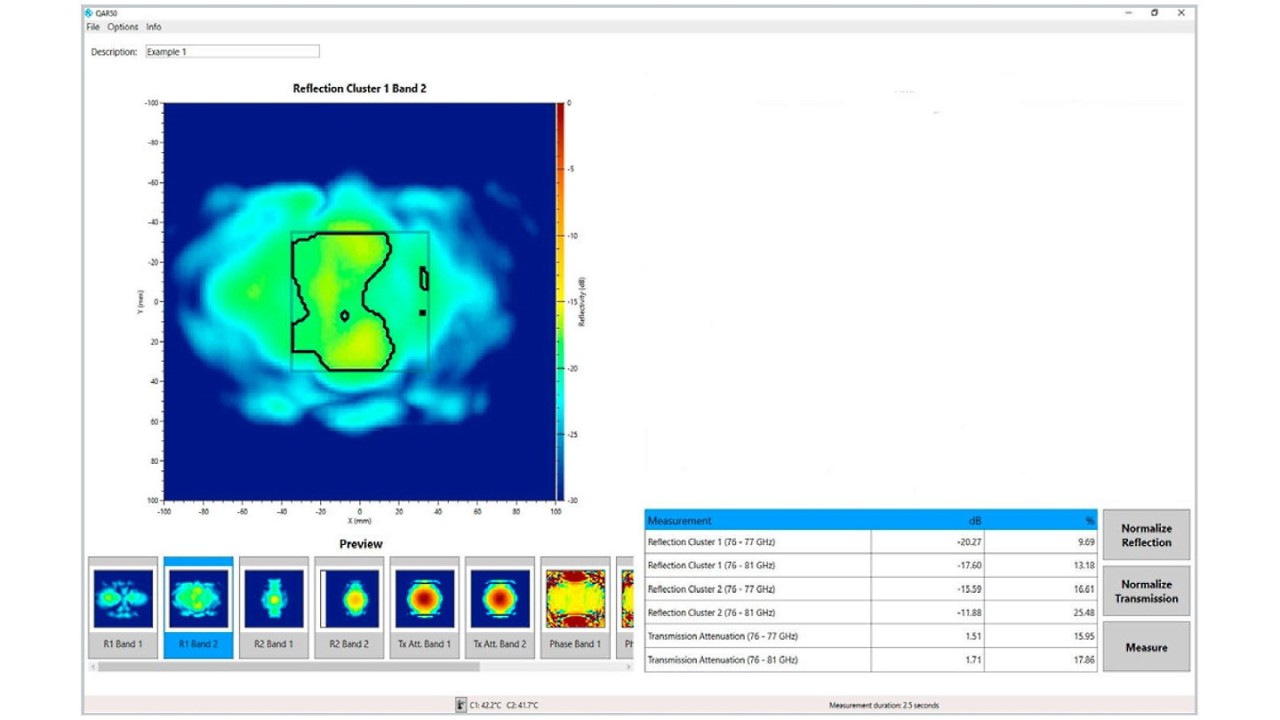
The R&S®QAR50 measures the mean reflection and transmission loss values for frequency bands 1 and 2 for a certain area on the DUT and displays them numerically.
Open Lightbox

Instrument setup

With its two clusters, the R&S®QAR50 measures as standard one-way transmission loss and reflection relative to the upper and lower cluster simultaneously in the 76 GHz to 77 GHz and 76 GHz to 81 GHz bands (bands 1 and 2).

When characterizing plastic materials, the streamlined user interface reveals all the necessary information at a glance. The simplified menu navigation makes it possible to operate the radome tester without detailed RF knowledge. The tester displays numerical values for the reflection and transmission loss results and provides information about the DUT positioning. This allows an easy interpretation of measurement results requiring no expert RF knowledge.

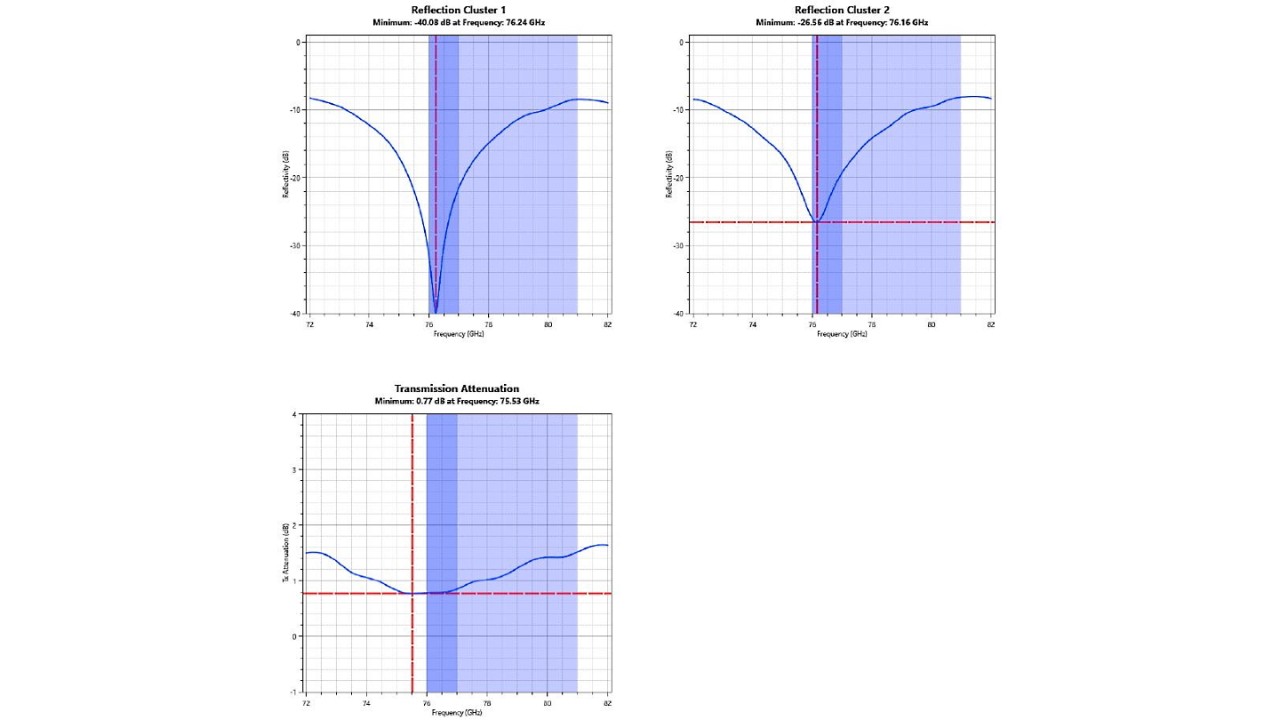
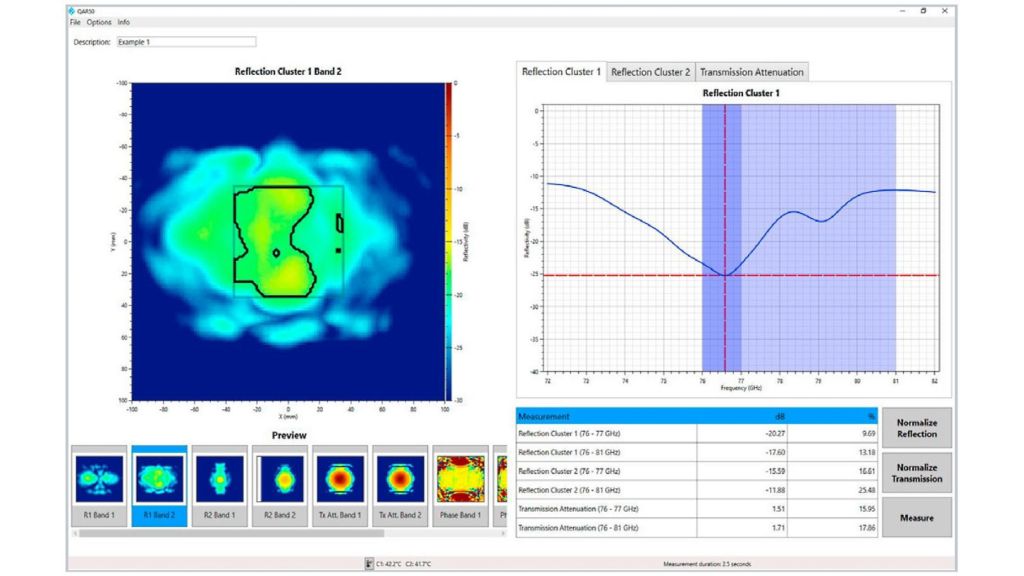
The R&S®QAR50‑K10 option provides a frequency range from 72 GHz to 82 GHz and shows the frequency response of the measured reflection and transmission loss.
Open Lightbox

To determine relative permittivity, it is necessary to display the reflection and transmission loss versus frequency for the automotive radar band. With the R&S®QAR50‑K10 option, the frequency response of the reflection and transmission loss is shown in the range from 72 GHz to 82 GHz.

The R&S®QAR50 equipped with the R&S®QAR50‑K10 option shows the reflection and transmission loss and the frequency response for the two quantities.
Open Lightbox

Measurement results

Due to its powerful calculation hardware, the R&S®QAR50 is capable of processing large amounts of data in a short period of time. The resulting images and frequency plots are available in just a few seconds. Depending on the selected parameters and data to be saved, extremely fast cycle times of less than 4 s can be achieved.

With respect to the measured parameters, precision, reliability and robustness are the core qualities of a measurement device. For this reason, the R&S®QAR50 quality automotive radome tester actually measures reflection rather than calculating it. Calculating the reflection based on the transmission phase and transmission loss information is theoretically possible but causes inaccuracies and is highly error-prone. Reflections have a major influence on the radome and bumper radar performance; being precise is therefore essential.

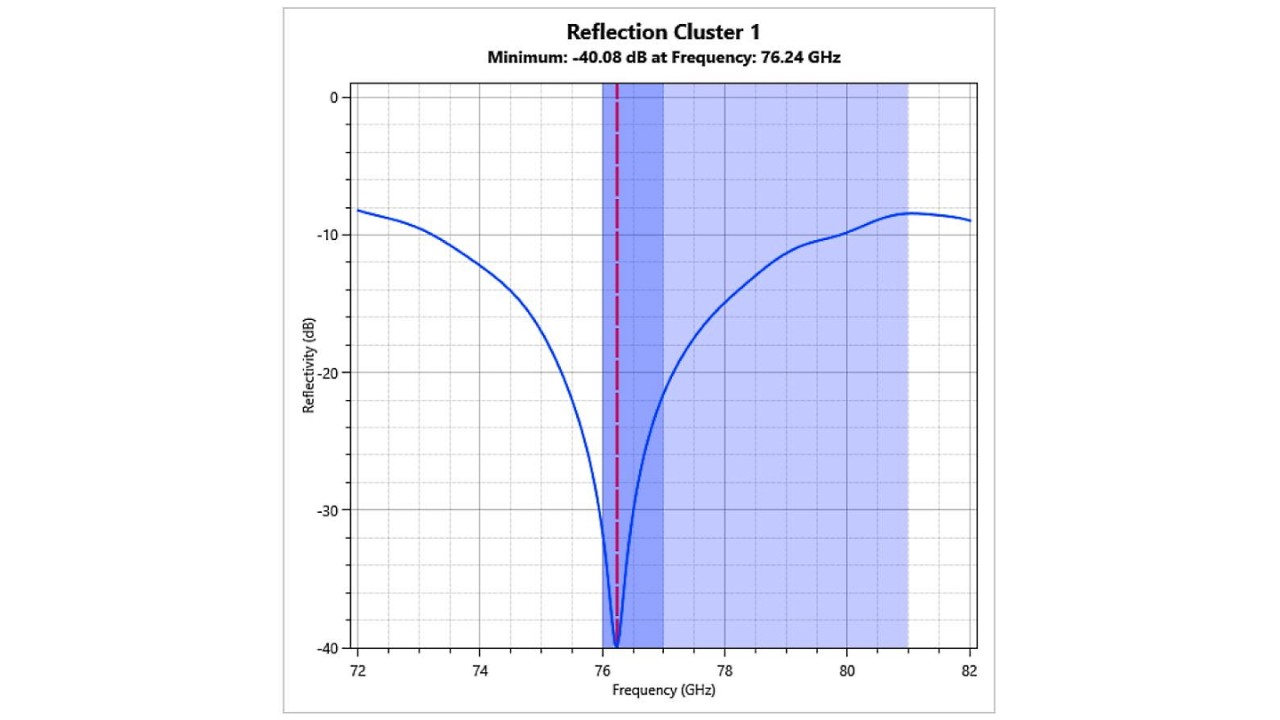
Blue line: trace. Red dotted line: trace minimum indicator. Purple area: radar band indicator.
Open Lightbox

The result diagrams show the frequency response of the DUT reflectivity (level), with the level displayed in dB over a specific frequency range. The R&S®QAR50 evaluates the level results within and around the typical radar bands. Result diagrams are available for both reflection and transmission loss measurements. In these diagrams, the x‑axis represents the frequency and the y‑axis the level or reflectivity. Scaling is adjustable.

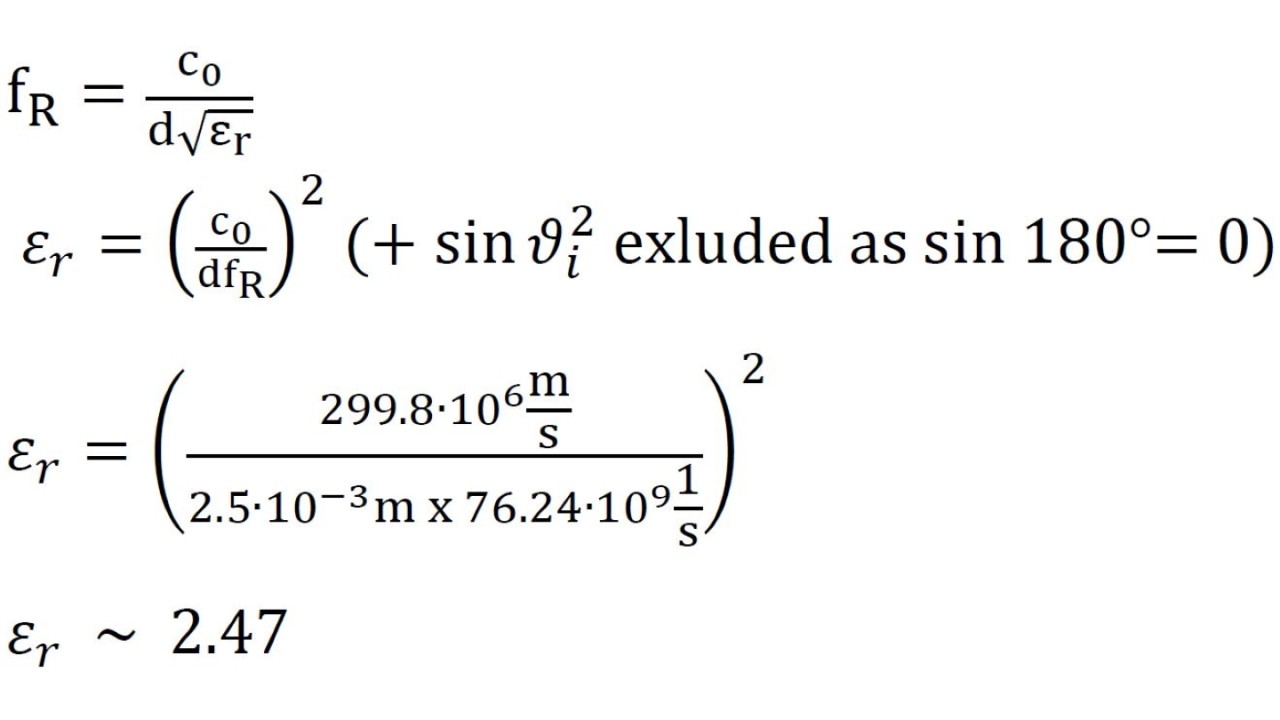
Ideally, the frequency response minimum is located within the operating frequency range of the radar sensor used together with the DUT. Displaced minima indicate that there are issues with the DUT’s electrical thickness and can be a subject for enhancement. Calculation of relative permittivity εr with fR = 76.24 GHz:

Calculation of relative permittivity
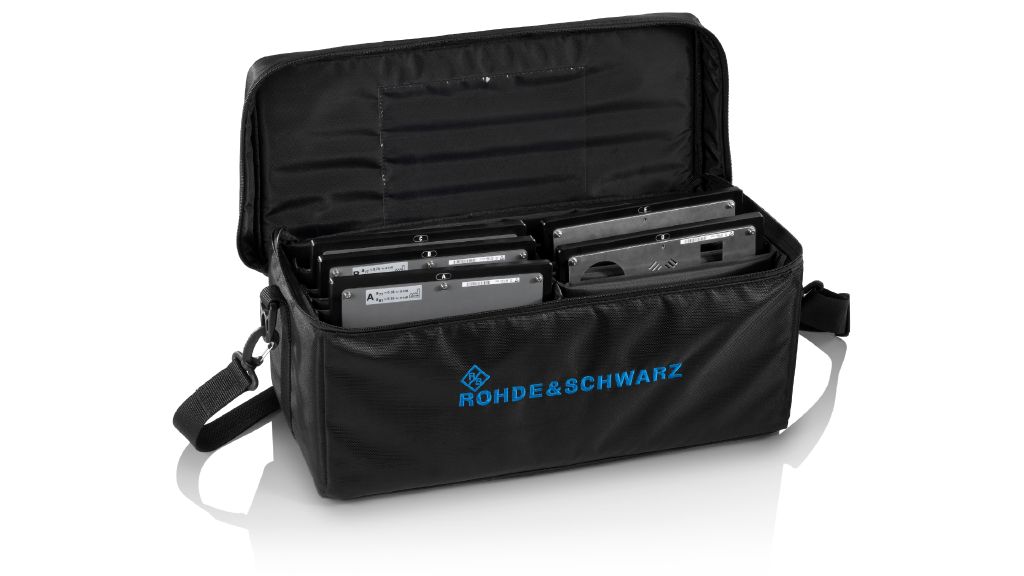
R&S®QAR-Z44 verification set traceable to national and international standards.
Open Lightbox

To ensure high measurement accuracy and repeatability, the tester’s measurement performance needs to be verified on a regular basis. With the R&S®QAR50‑Z44 verification set, the R&S®QAR50 performance for reflection and transmission loss measurements can be easily verified. The R&S®QAR50-Z44 verification set is traceable to national and international standards, providing a unique solution.

Summary

Testing and optimizing the properties of radomes and bumpers when designing and qualifying the structures of the materials used is highly complex, costly and time-consuming. It is therefore left to chemical companies to test and validate the RF performance of polymers before they are brought into shape.

The approach described here enables faster and less complicated material characterization and optimization at an early stage. A standardized method for determining radar permittivity can be integrated into quality control. In this way, the quality of materials can be checked early, avoiding high follow-up costs at subsequent design stages.

The R&S®QAR50 is the ideal tool for accurately characterizing polymers and their potential influence on automotive radar sensor performance in the automotive radar frequency range during all product phases from design to end-of-line testing in production. Its innovative hardware concept enables impressively fast measurement times combined with easy handling. The measurement concept in combination with a straightforward user interface requires no special RF or microwave knowledge.