Battery cycle tool for the R&S®NGU401/NGU201/NGM200/NGL200
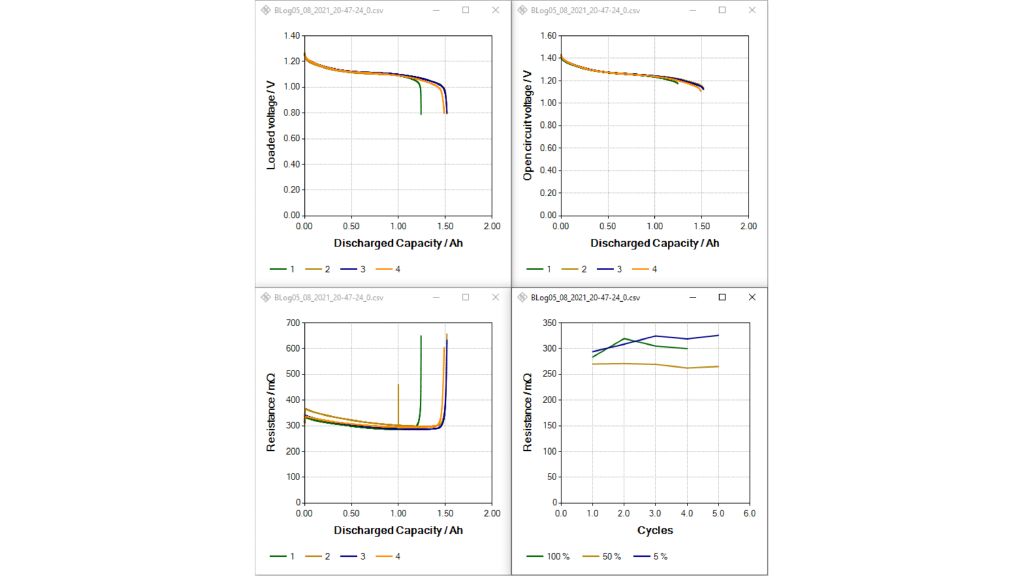
The battery cycle tool has several charts that display collected data and can be used to characterize battery samples and create battery models.

The battery cycle tool has several charts that display collected data and can be used to characterize battery samples and create battery models.


Your task
Understanding and testing your battery at various points in a charge cycle is important. Monitoring voltage and internal resistance against the charged and discharged battery capacity is a vital data source, which can then be used to create a battery model for future testing.
Rohde & Schwarz solution
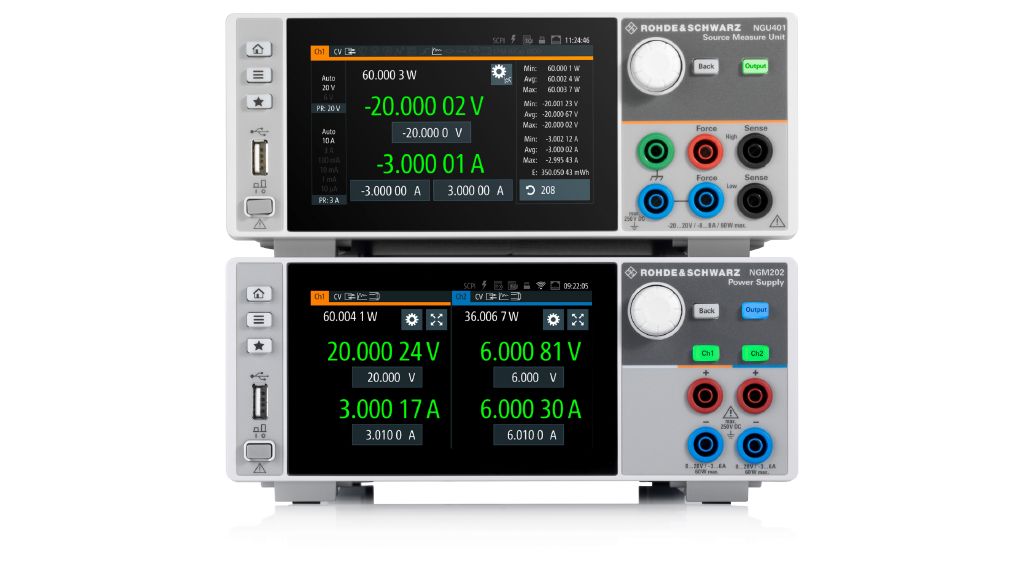
Rohde & Schwarz has a battery data collection and analysis tool that cycles battery samples with two-quadrant DC power supplies from Rohde & Schwarz. The batteries can be repeatedly charged and discharged while collecting information about open-circuit voltage, loaded voltage and internal resistance. Battery charge or discharge data can be used to create battery models for R&S®NGU201/ NGM200 battery simulations.
Cycle tool features
The tool has several unique features to help compile and analyze battery cycle data.
Constant and pulsed current charging
Constant current and pulsed current are used to charge and discharge a battery and the open-circuit voltage of the power supply can be set for both. Only pulsed charging can be used to determine internal resistance and battery models must use pulsed charges for discharge data.
Versatile charge-end criteria
The chemistry in many batteries makes it difficult to precisely determine the full state of charge using measured properties. The charge-end criteria protect batteries from overcharging, but the discharge process can precisely determine battery capacity.
Supported and configurable charge-end criteria are voltage, voltage plateau, negative delta voltage, low voltage, capacity and time limit. Multiple criteria may be selected. All voltage criteria can be applied either to the voltage under charge or to the (extrapolated) open-circuit voltage with the pulsed charging method.
Live updates and postprocessing charts
The dashboard tab maintains an overview of the battery status during the cycle. Live updates of minimum, maximum and average readings for power, instantaneous voltage and current are updated on the instrument. Energy and charge are also updated in the display.
During the cycle, four charts show the voltage and internal resistance in real time.
Files from previous cycles can be opened for further processing in the postprocessing tab. Charts of various values versus charged or discharged capacity or versus number of executed cycles can be displayed. Six charts plot voltage or internal resistance versus charged or discharged capacity. The central buttons on the display can be used to select cycles for the traces in the chart.
The seventh chart shows discharged and/or charged capacity versus cycles. Multiple cycles can be used to examine the effects of aging on the batteries under test. Charts can also show internal resistance during discharge or charge relative to the number of cycles. In each chart, a maximum of three traces plot the internal resistance at configurable states of charge. A battery model can also be generated for the R&S®NGU201/NGM200 battery simulation.
Battery model creation
The create battery model field lets you turn logging data from battery cycles into a battery model for the R&S®NGU201/NGM200 simulation. Battery capacity is always determined based on the discharge data from the same cycle for the battery models. When generating a battery model from charge data, battery capacity is determined from charging instead of discharging.
Summary
Understanding and testing the your battery characteristics at different points in a charge cycle are critical. Rohde & Schwarz has a battery data collection and analysis tool with configurable settings for tool features that can be used to test a wide range of battery types. The tool has a postprocessing tab to display and process collected data to create battery models for the R&S®NGU201/NGM200.

