Predict the lifetime of your battery with the Rohde & Schwarz power consumption
The Rohde & Schwarz power consumption analysis tool helps evaluate power consumption data collected with Rohde & Schwarz power supplies.

The Rohde & Schwarz power consumption analysis tool helps evaluate power consumption data collected with Rohde & Schwarz power supplies.
Your task
Battery lifetime requirements can range from ten hours for wearables such as smart watches to ten years for smart sensors. Understanding where and when energy is consumed helps minimize power consumption and is crucial for all these devices.
Rohde & Schwarz solution
The power consumption analysis tool makes it easier for customers to analyze power consumption data collected with R&S®NGM/NGU power supplies. Power consumption data is easily captured and analyzed with basic measurements. The R&S®NGM/NGU astlog function can capture up to 500 ksample/s. Logging is possible from one channel at a time.
Test setup
The Rohde & Schwarz power consumption analysis tool supports LAN and USB connections to a power supply. An automatic discovery function detects all test and measurement instruments connected to a PC USB port or to LAN segments connected to a PC LAN adapter.
Setup measurements
The specific settings for a device under test (DUT) are entered directly on the power supply: output voltage, optional output current limits, capacitance mode settings, overvoltage, overcurrent, overpower protection, etc. Make sure they are set correctly before activating the power supply output to avoid damaging your DUT.
The power consumption analysis software can be used for the logging settings. Autorange behavior can be controlled in the settings tab.
Select start/stop logging, rolling or full to control data quantity and visualization.
Both current and voltage data are logged from the power supply. Current, voltage or power can be shown. To get a better overview of very low current levels, data can be shown on a linear vertical scale or a logarithmic one. A data line showing a moving average can also be added to the chart.
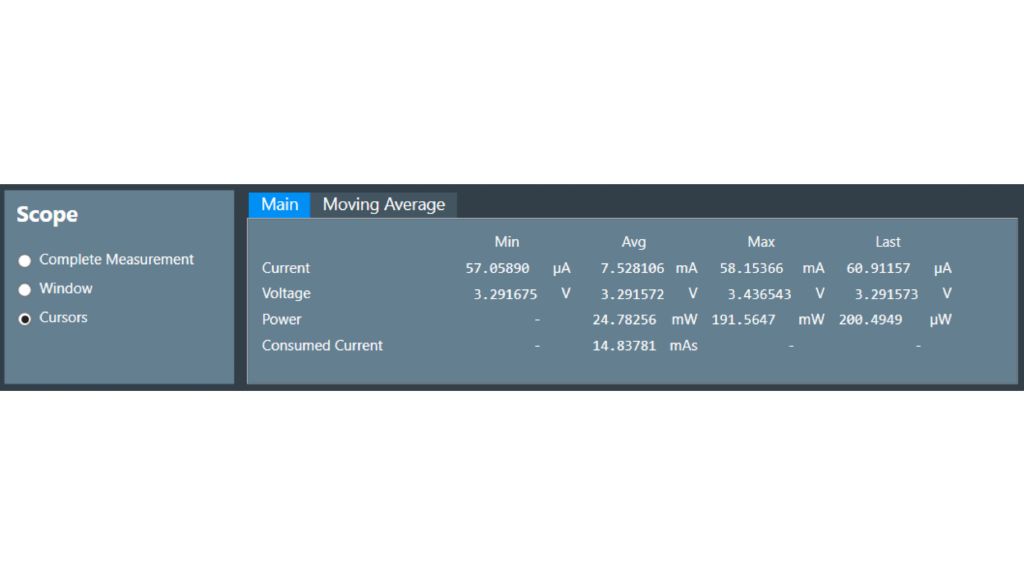
The power consumption analysis tool allows basic measurements, such as cursor measurements. The minimum, average, maximum and final values in the data set for current, voltage and calculated power are also shown. These evaluations can be done for the entire captured trace or restricted to the data shown in the window or between the cursors.
Captured trace data can be exported and imported. Export is possible in the native (raw), .csv and Matlab file formats.
Summary
To optimize battery life for battery-powered devices, minimizing power consumption is crucial. R&S®NGM/NGU power supplies and the 1SL380 application program can be used to capture and evaluate delivered current and voltage versus time, making it possible to precisely determine the consumption of a battery-powered device in different states of operation.

