Written by Manuel Mielke | July 22., 2021


Internal interference is one of the two types of interference which can occur. Another example of internal interference are overlapping cells, especially at the edge of cells. This type of internal interference is unavoidable, but SINR (signal-to-noise and interference ratio; wanted vs. unwanted signals) measurements in the field can be analyzed to learn more about and avoid this type of internal interference.
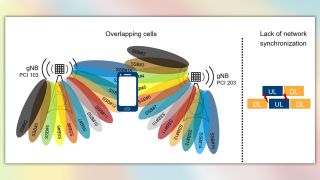
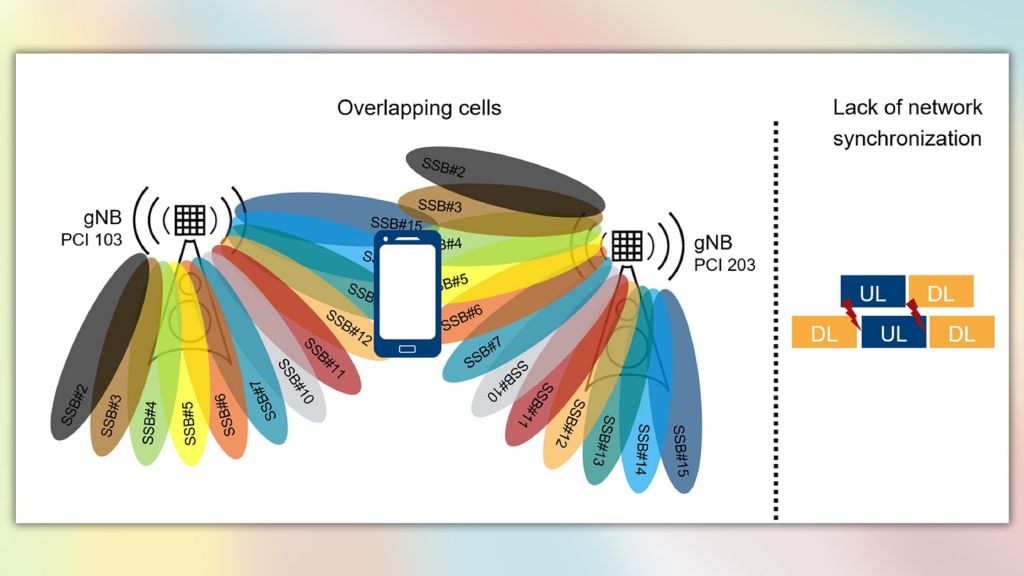
To summarize: Internal interference can be measured and analyzed by measurement receivers such as the R&S®TSMx network scanner family, which can measure arrival times of the signal and the SINR. After the data has been analyzed, the network can be optimized by checking the internal master clocks for better network synchronization or by optimizing the cell geometries (e.g. tilt, antenna pattern modification).
Now let's take a look at the second type of interference. It is called external interference. As the name suggests, external interference comes from external interference sources. Even a perfectly optimized network with an internal interference level of close to zero can still suffer from external interference. External interference is a very broad topic because it can have very odd causes such as faulty SAT LNBs used for TV reception, solar panels on the roof, engines, power supplies, power transformer stations, power inverters... Let's stop brainstorming and instead focus on how we can detect it.
Let's talk about the most significant case of external interference. Let's assume the interference hits uplink slots in 5G NR TDD. From a gNB perspective, the uplink is an extremely weak signal and even low levels of interference can completely interrupt communication between the user equipment and the network. It is therefore essential to detect the interference and to remove the interference source as quickly as possible. But how do we find the uplink slots and measure the power spectrum within them?
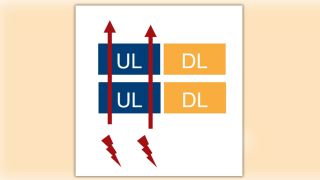
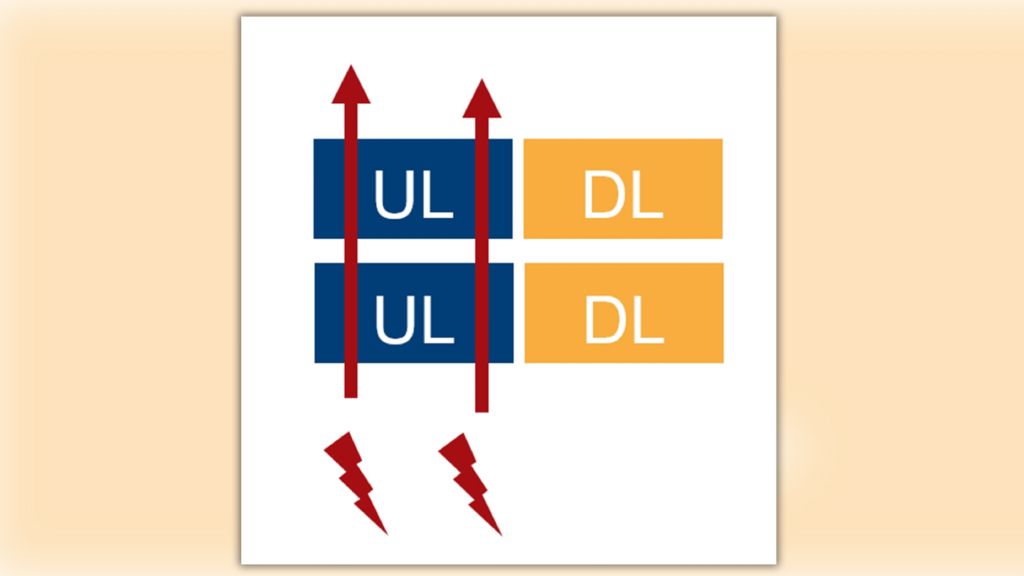
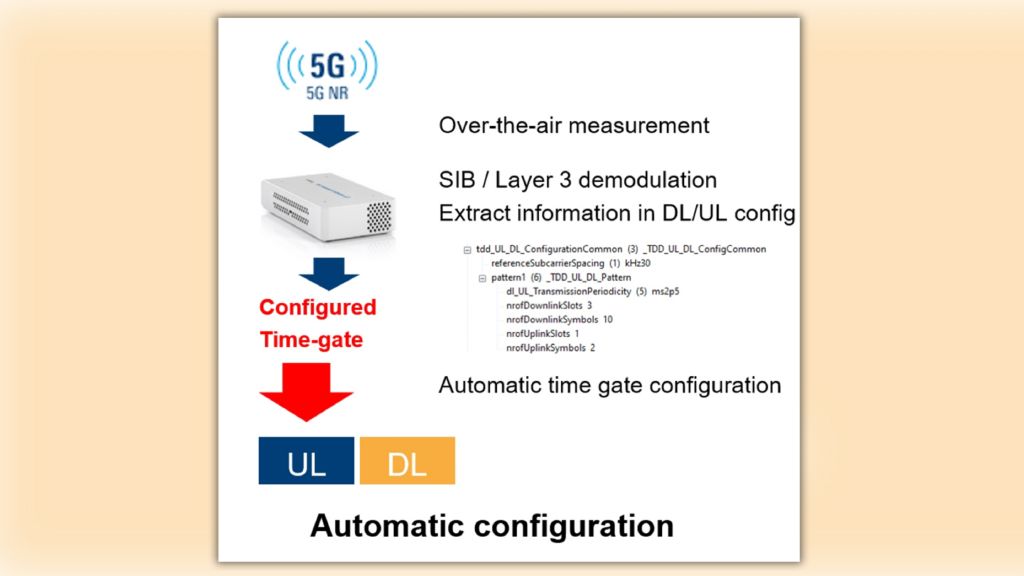
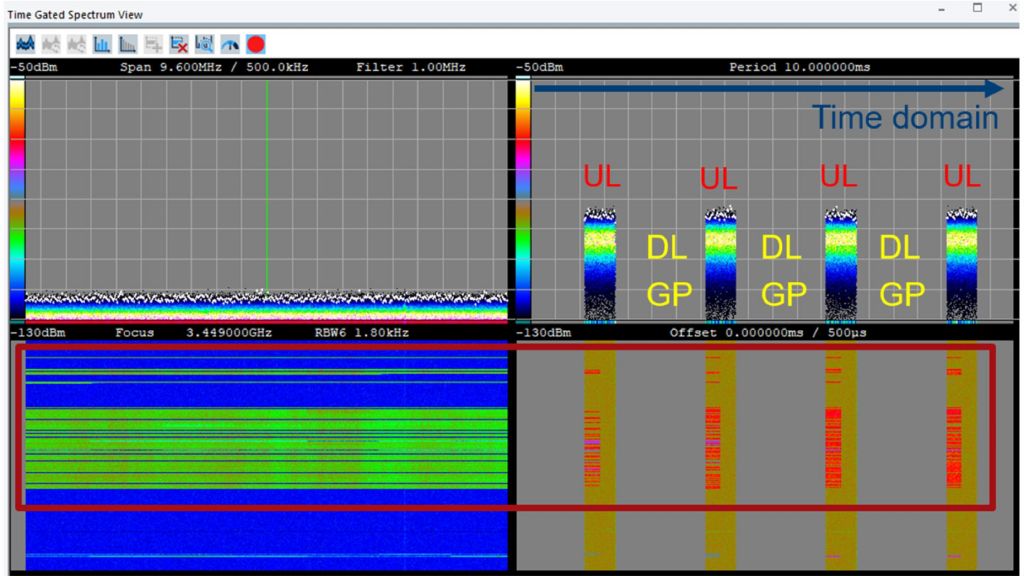
With the R&S®TSMx network scanner family, this is easy. From the system information, the instrument is able to read the periodicity, slots and symbols reserved for uplink and downlink transmissions in the TDD network. Once detected, the network scanner synchronizes to the TDD transmission pattern, applies a time-gate and delivers a real-time spectrum of the configured time-gate, e.g. of the uplink.
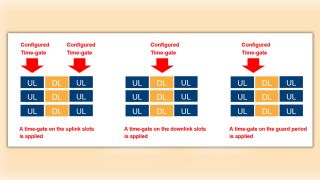
Applying a time-gate is like fading out all other time slots such as the downlink and the guard period. The result is a pure uplink spectrum. Of course, the time-gate can also be applied on the downlink and / or guard period, for example in order to visualize traffic in the downlink or to check if the guard period is maintained.
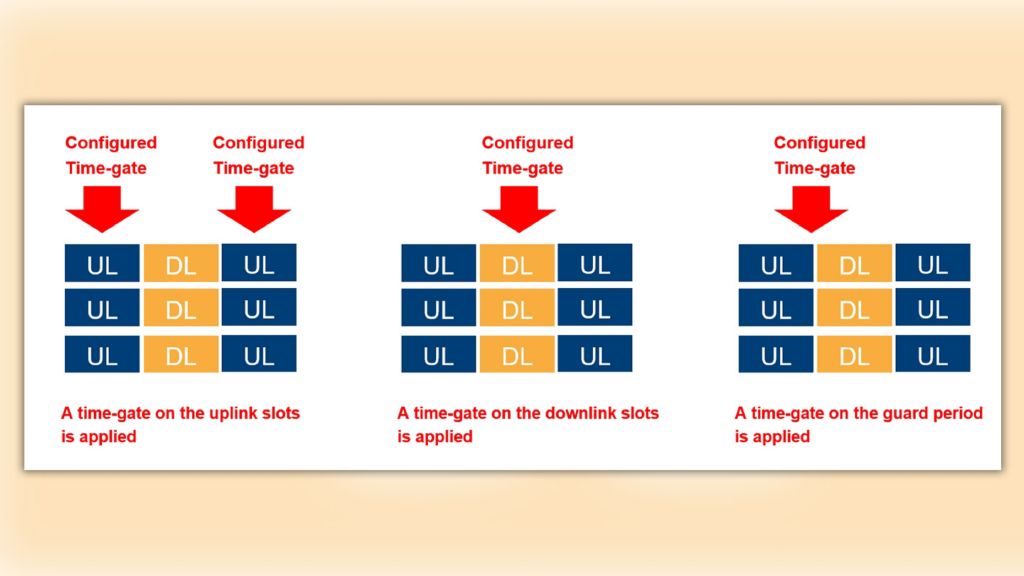
The real-time spectrum on the frequency domain can be visualized in a panoramic view, which covers max. +/100 MHz apart from the 5G SSB center frequency, or in a so-called hunting view which covers a spectrum of max. 9.6 MHz bandwidth in order to focus on the interference source. This is the perfect view to start hunting the interference, for example by walking around with a directional antenna.
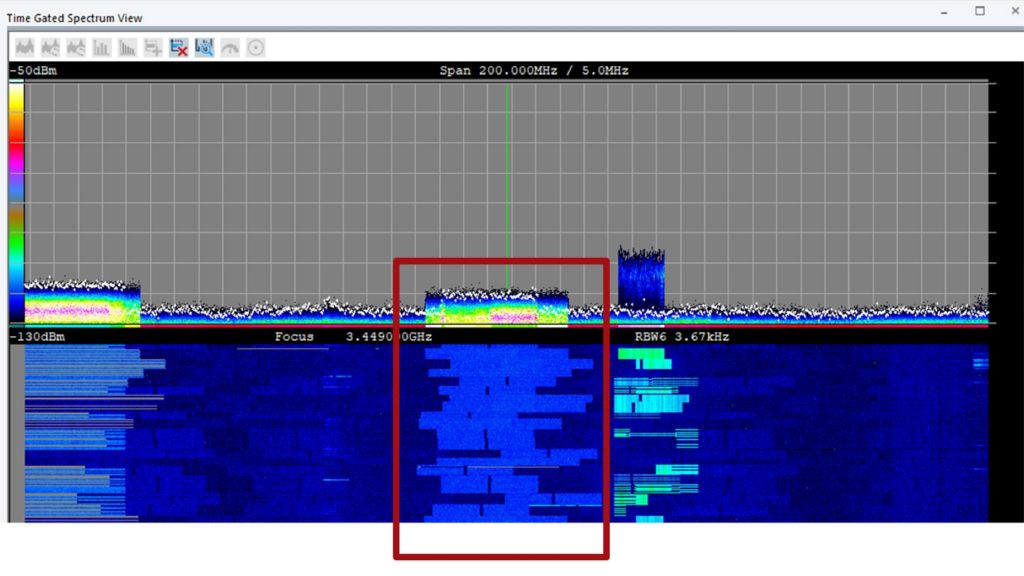
External interference can occur irregularly or periodically. In many cases, this allows conclusions to be drawn with regard to the interference source. The behavior in the time domain can be verified by a second view, the so-called time-periodic view. It visualizes the time-gated spectrum in the time domain within a user-configurable period of time (e.g. 10 ms). With the help of this time-periodic view, the user is able to draw conclusions with regard to the periodicity of the interfering signals in the time domain.
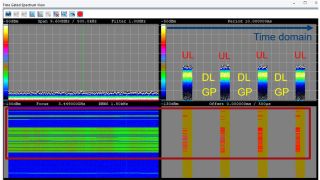
In combination with the metrics for internal interference such as SINR and TAE measurements, the R&S®TSMx network scanner family provides a perfect tool for classifying, narrowing down and hunting internal and external interference. With its ability to decode system information messages and to synchronize to the radio frames, the system simplifies interference detection and hunting.


