Written by Andreas Spachtholz | August 10, 2018


Many requests focused on the in-band operation mode of NB-IoT within the LTE carrier. It is important and often required to mark the location of the Physical Resource Blocks (PRB) used for NB-IoT.
Other requests concerned the visualization of interference between NB-IoT and LTE. The impact LTE has on the NB-IoT carrier is of significant importance because it determines the network performance of NB-IoT. To provide and visualize such information, it is essential to scan NB-IoT and LTE in parallel.
Customers also wanted to know the total number of NB-IoT and LTE cells that were transmitting and could be measured at a certain location.
MIB/SIB demodulation in NB-IoT networks
Our answer to these customer requests is the demodulation and decoding of the NB-IoT base station’s Master Information Block (MIB) and System Information Blocks (SIB). The MIB provides important information about the deployment of the NB-IoT network. Our network analysis and drive test software R&S®ROMES now reads this information and combines it with other sources to offer users more value.
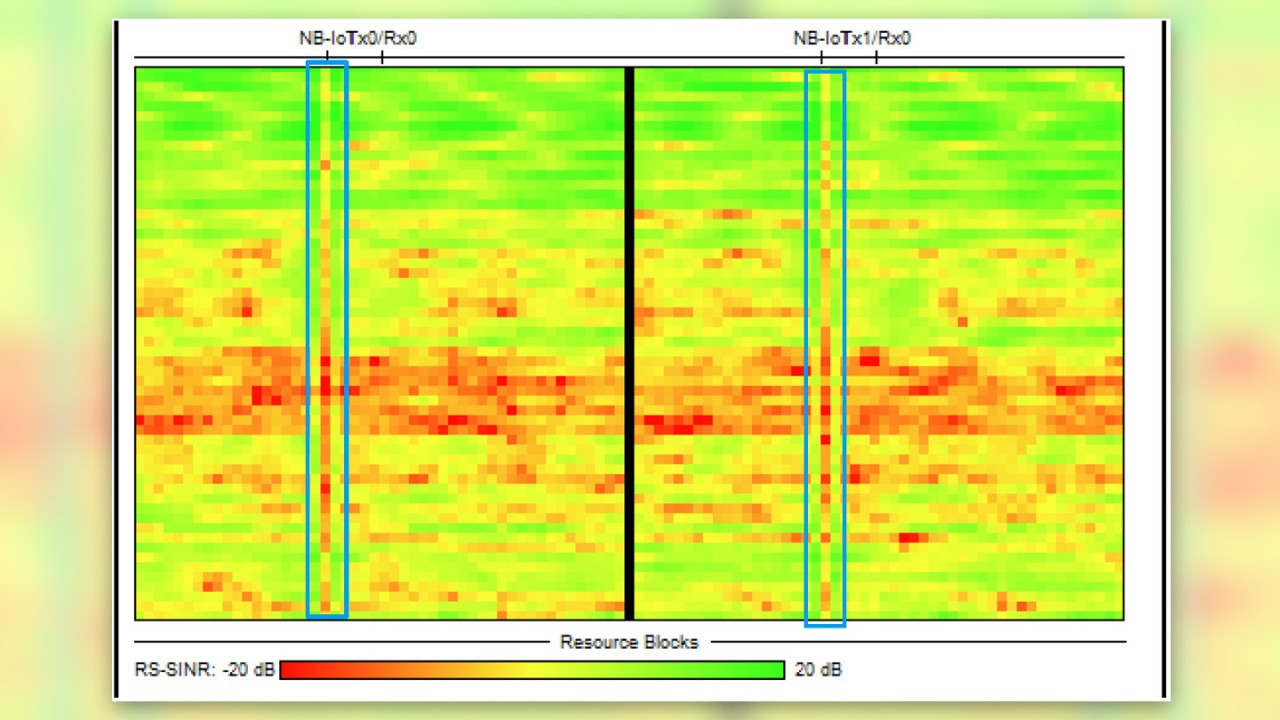
In in-band operation of NB-IoT, R&S®ROMES shows the PRBs that are used for NB-IoT in the scanner subband view (see image 1 below). This lets users check the interference situation of both LTE and NB-IoT cells easily.


Image 1 shows the LTE subband view of the RS-SINR after LTE scanning. The NB-IoT carrier (1 PRB) is redder. This is because LTE interprets the signal as interference due to its lower SINR on the LTE PRB (in red).
The PRBs on the left and the right of the NB-IoT carrier are greener than other PRBs. This is because the LTE base stations in the example avoided scheduling LTE resources in the 2 PRBs surrounding the NB-IoT carrier. Consequently, the LTE SINR in the 2 PRBs is better (in green).
On top of the graph, the mark “NB-IoT” highlights the NB-IoT carrier in in-band operation. This is only possible due to simultaneous LTE/NB-IoT scanning and the visualization in R&S®ROMES.
Decoding SIBs in NB-IoT networks
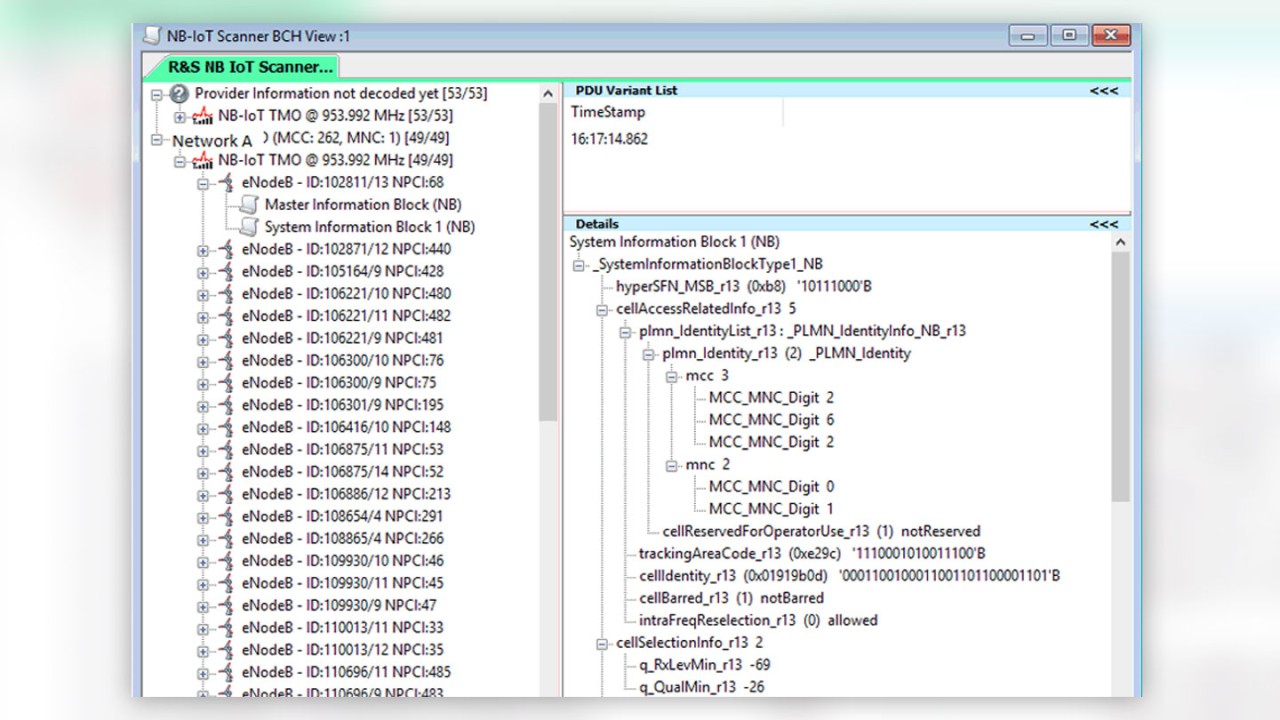
Our answer to our customers’ request for NB-IoT network and cell identities is the SIB1 decoding. This provides information about the networks’ PLMN and the cells’ cell identity. R&S®ROMES4 creates the broadcast channel (BCH) view (see image 2) and lists all the received NB-IoT cells during a scanner measurement. These are sorted by PLMN and EARFCN and include the decoded MIB and SIB messages. This view lets users search for cells and export information for further post processing.
The SIB1 decoding informs users about the transmitter that is currently the best server in a certain region. This can be visualized on a map. All other SIB messages are also demodulated and decoded, offering users the complete picture of the current network configuration; for example, from the SIB2 messages, users can easily read out the actually configured RACH configuration.
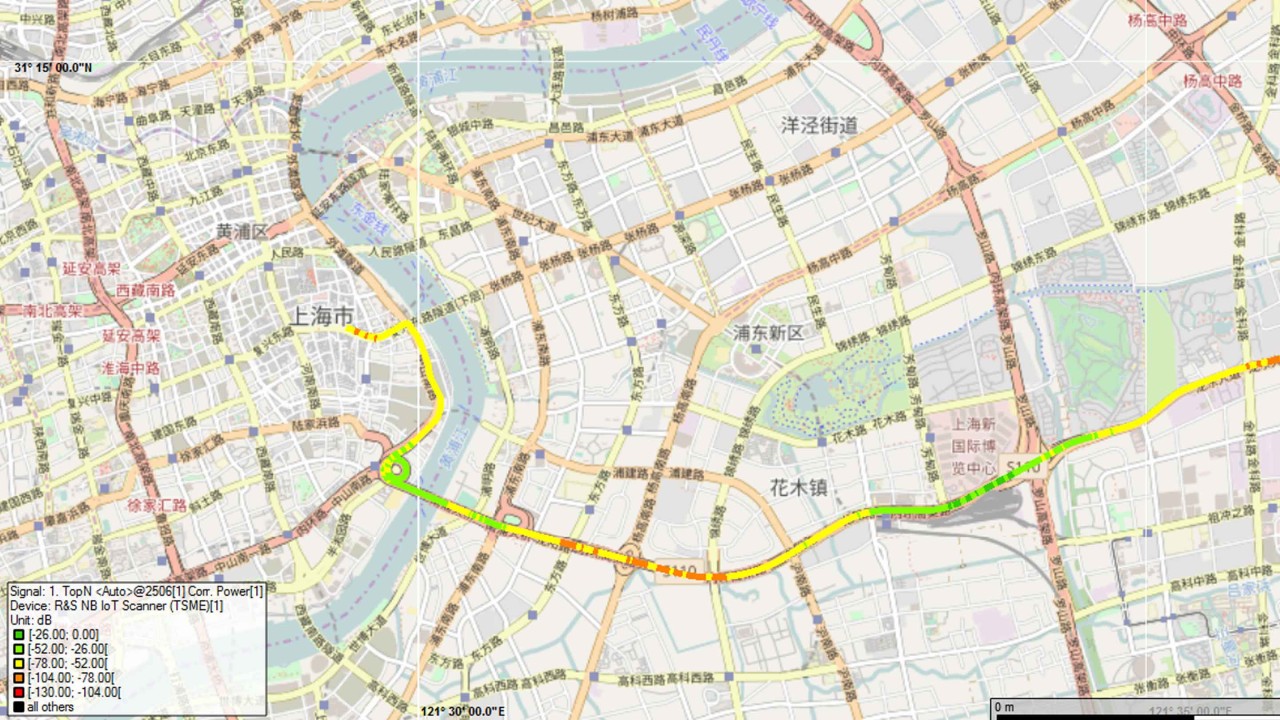
Thanks to valuable customer feedback from NB-IoT field engineers, the functionalities of our NB-IoT coverage measurement solution – comprising an R&S®TSMx scanner and R&S®ROMES – have been extended. The visualization of parallel measurements and the decoding of broadcast messages help users get a more detailed overview faster. The scanner’s measurement performance, in terms of scanning NB-IoT and LTE (5 Hz) in parallel and at high speed, its sensitivity and dynamic range remain unmatched on the market.


