Do not blame the DUT: Hidden errors in measurements
Compensating cable-induced errors in DUT measurements with the R&S®CableRider ZPH cable and antenna analyzer

Compensating cable-induced errors in DUT measurements with the R&S®CableRider ZPH cable and antenna analyzer


Reliable communications starts with verified cabling integrity
Your task
As a preliminary step in testing the device under test (DUT), your task is to measure frequency-dependent attenuation of the RF measurement path. The goal is simple: eliminate cable-induced level errors, which typically grow with frequency. This task gets more challenging in field service, where access to standard lab calibration kits is limited. Even a small level error can become critical when performing limit checks or troubleshooting. Without compensation, it will introduce the combined response of the DUT and components (such as cables, connectors and attenuators), potentially creating a false failure or masking a real defect.
Rohde & Schwarz solution
With its small form factor and long battery life, the R&S®Cable Rider ZPH cable and antenna analyzer is well suited for portable and outdoor measurements. Its twoport model supports S21 cable and antenna testing (CAT)
and vector network analyzer (VNA) measurements and enables the characterization of frequency-dependent transmission behavior of cables and other components. A transducer file (also called a correction or compensation file) is a data table containing frequency-level pairs, where the level indicates the required mathematical compensation to correct for the losses of external hardware like cables or connectors at that specific frequency.
A transducer file does not contain phase information. When applied to a measurement, the R&S®ZPH uses this frequency-dependent correction to compensate for systematic losses introduced by the measurement.
The transducer files can be obtained in several ways:
Application: Measure the RF output power at the DUT’s antenna port
The R&S®ZPH is used to measure the exact power at the antenna port of a two-way radio (i.e. DUT) without the level error caused by the cables, connectors and RF attenuator. The test can be done by following the four steps described below.
Step 1: Normalization using tracking generator and spectrum analyzer
Normalization calibrates the R&S®ZPH to eliminate its internal frequency response. Because temperature and humidity shifts alter this internal response, normalization is required to compensate for these environmental changes.
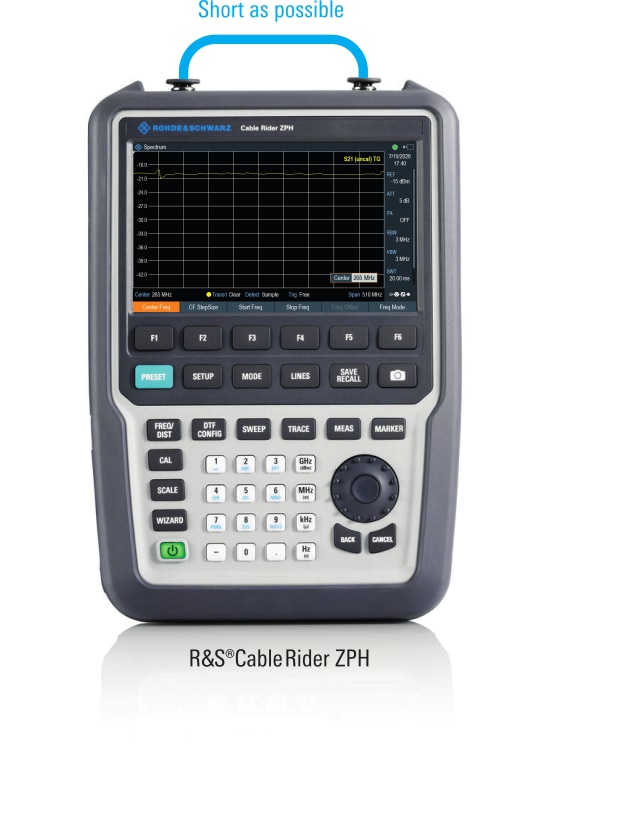
First, connect a short through cable between the RF output and RF input ports of the R&S®ZPH, as shown in Fig. 1. Then go to the measurement menu, select source mode and turn on the tracking generator.
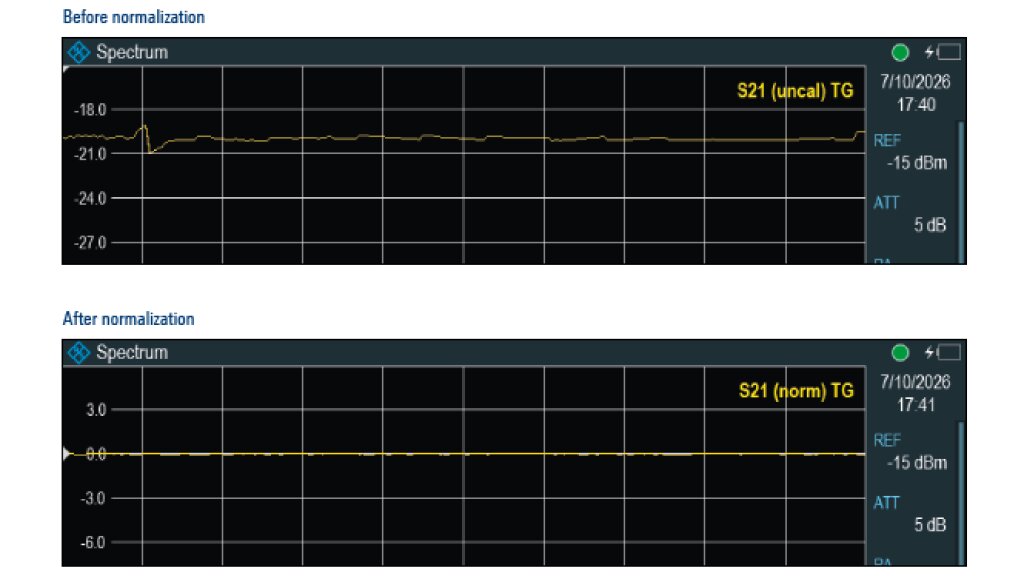
When “normalize” is pressed, the S21 status changes from “uncal” to “norm” on spectrum analyzer, as shown in Fig. 2.
This normalization could also be done using the complete setup instead of the through cable, but it would need to be repeated every time the setup changes. It is therefore simpler to measure each cable individually and store the data for each cable. For future measurements, you then only need to load the corresponding transducer file.
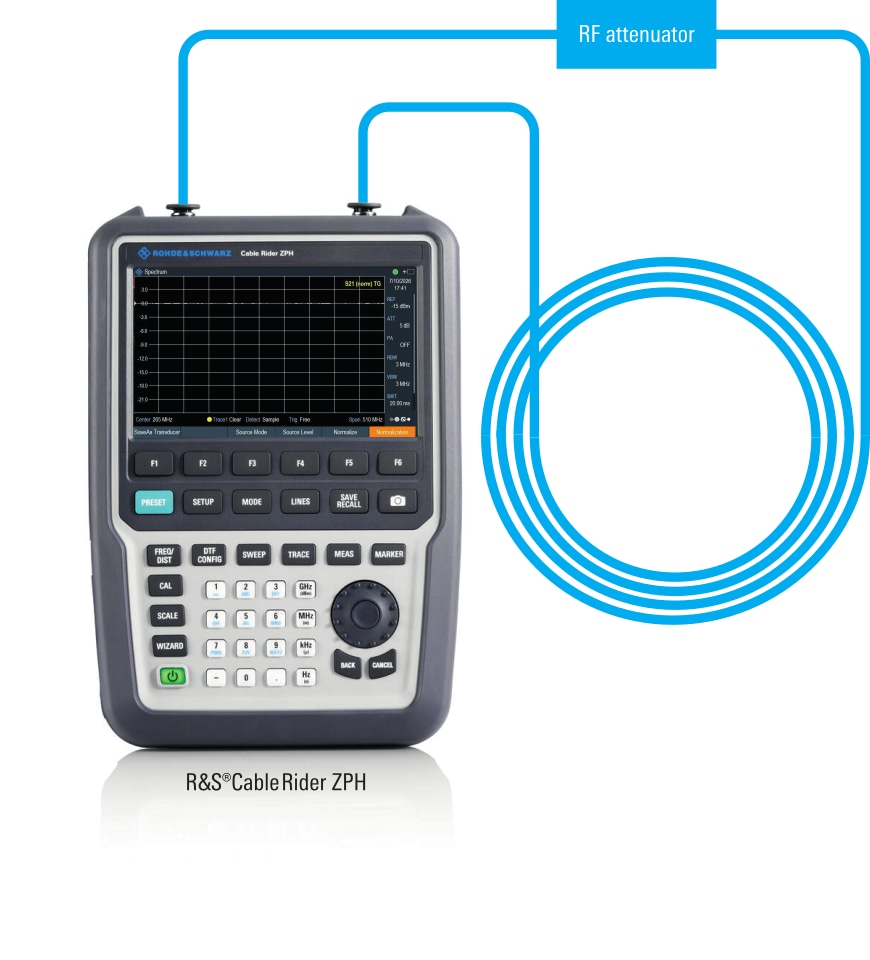
Fig 3: R&S®ZPH with two long cables and external attenuator
Step 2: Generate a transducer file for compensation of the connection
Next, connect long non-ideal cables. If additional components are required, such as an attenuator (which may have a frequency response too), add these in the measurement, as shown in Fig. 3.
Once the connection is set up, do the frequency sweep and store the correction data as a transducer file in the *.sectrd format, by clicking “SaveAs Transducer”, as shown in Fig. 4. The transducer file is under the user- transducer folder.
Step 3: Activate transducer function
To activate the transducer function, return to spectrum mode and turn off tracking generator under “source”. Then, load the corresponding transducer file; see the label in Fig. 5.


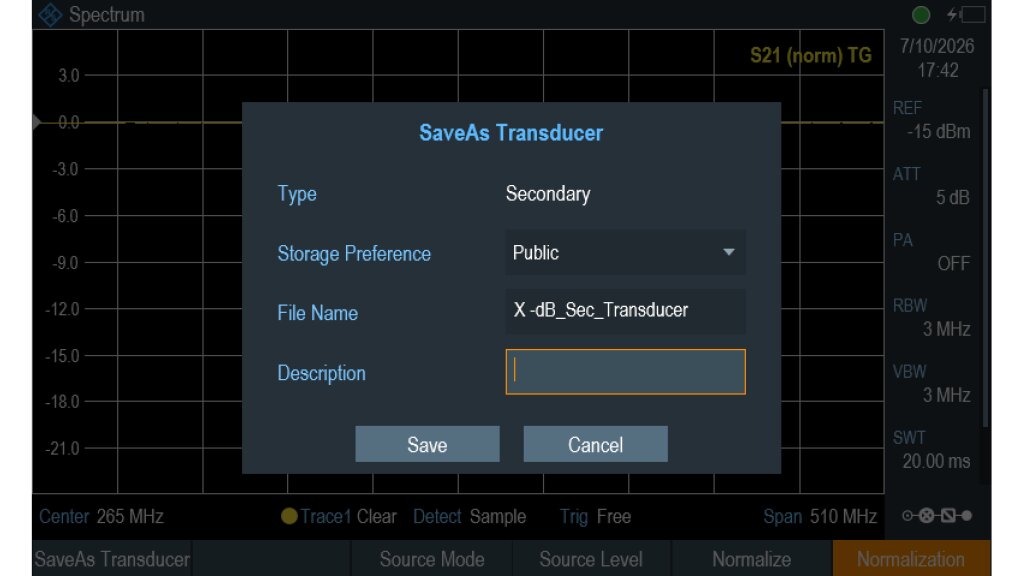
Fig. 4: Use the “SaveAs Transducer” function
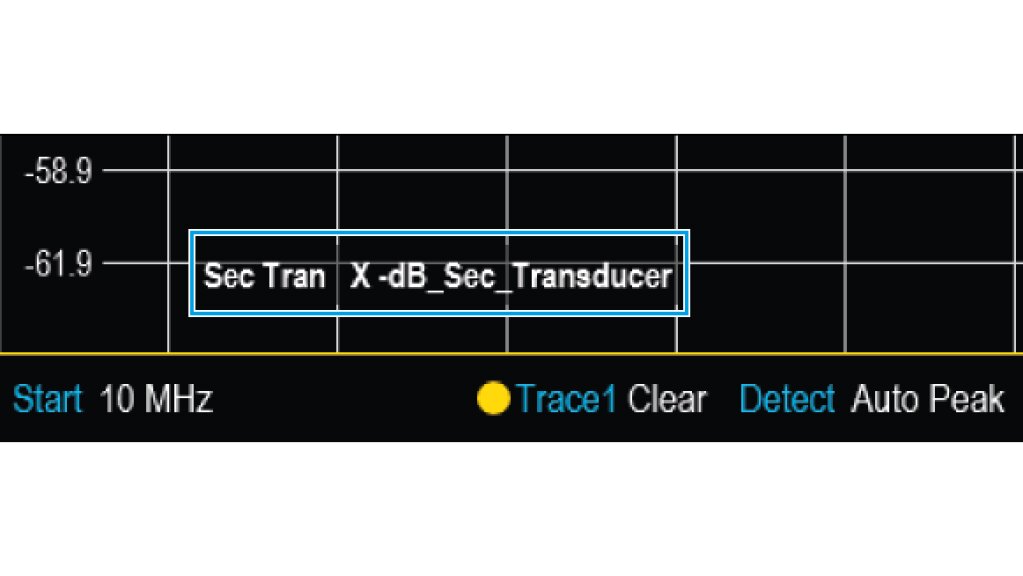
Fig. 5: Label to show transducer is loaded successfully
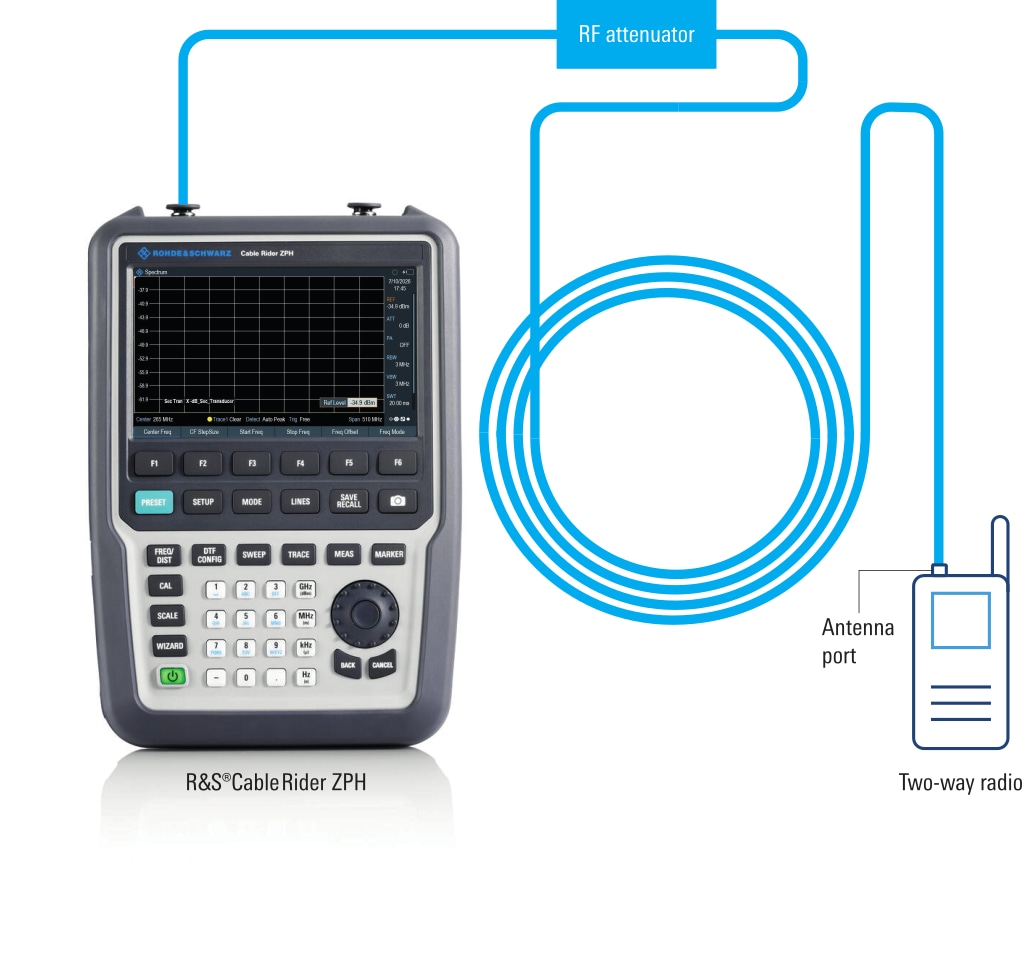
Fig. 6: Direct power measurement of a two-way radio transceiver with an R&S®ZPH
Step 4: Do the measurement
Now, you can connect the DUT to the RF IN port and see the true level in spectrum analyzer of the R&S®ZPH as shown in Fig. 6.
Once the transducer files have been created, the cables can be swapped easily without having to re-characterize them each time.
Related products