Easy testing of interferometric direction finders

The R&S®RF Ports Alignment Software together with the R&S®SMW-K545 option provides a standard and tailored solution for calibrating and aligning the amplitude, group delay and phase between the RF ports of multiple coupled dual-path or single-path R&S®SMW200A vector signal generators. In addition, the R&S®Pulse Sequencer Software supports users to calculate the required signals for interferometric direction finding (DF) test cases. The R&S®SMW200A signal generator hardware together with the aforementioned software packages enables precise angle of arrival (AoA) simulation for testing the true performance of interferometric direction finders or emitter location systems.

The figure shows a setup with four RF ports for wideband I/Q modulation and a vector network analyzer and power sensor for collecting the correction data.
Fig. 1: The figure shows a setup with four RF ports for wideband I/Q modulation and a vector network analyzer and power sensor for collecting the correction data. The R&S®RF Ports Alignment Software makes it easy to precisely align signals between RF ports. It compensates amplitude, group delay and phase offsets between the RF ports at a user-defined reference plane. The R&S®Pulse Sequencer Software supports definition of AoA test cases with a simple and intuitive graphical user interface.
Ingrandisci immagine

Your task

Many modern military aircraft include advanced electronic support measures (ESM) as part of their self-protection systems. ESM systems commonly use interferometric direction finders to determine the AoAs of emitter signals. These advanced systems allow aircraft to locate emitters with a higher accuracy compared to earlier, simpler radar warning receivers that use amplitude based DF techniques. Plus, interferometric direction finders can better cope with signals simultaneously arriving from multiple emitters.

Interferometric direction finding exploits the fact that a signal incident on an antenna array will have a different phase shift at each individual array element. Several algorithms can be used to determine the AoA very accurately.

An AoA simulator needs to be flexible enough to provide everything from simple radar pulses for early hardware validation to complex, multi-emitter scenarios for testing at the system level.

The task of developing and testing a direction finder is greatly simplified if engineers can easily generate a variety of signals in the lab to verify the performance of a DUT against various emitter scenarios.

Ideally, the simulator hardware comes as a commercial offthe-shelf (COTS) solution, eliminating the need for designing expensive and inflexible custom hardware. For most accurate signal generation for AoA simulation, the test setup should offer a user-friendly option enabling precise alignment of amplitude, group delay and phase between the RF ports at a defined reference plane.

Defining signals and creating complex scenarios must also be easy and straightforward, avoiding the time-consuming task of writing extra simulation software.

This setup is suitable for simulating the angles of arrival (AoA) of multiple emitters, using two coupled dual-path R&S®SMW200A vector signal generators.
Fig. 2: This setup is suitable for simulating the angles of arrival (AoA) of multiple emitters, using two coupled dual-path R&S®SMW200A vector signal generators. The R&S®Pulse Sequencer Software automatically calculates the relative group delay, relative phase or relative amplitude values for the RF ports.
Ingrandisci immagine

Rohde & Schwarz solution

The R&S®SMW200A vector signal generator can provide two RF paths up to 44 GHz. Multiple R&S®SMW200A generators can be coupled to form a compact, scalable simulator to deliver phase coherent RF signals.

To achieve phase coherence across all RF paths, it is necessary that all I/Q modulators in the R&S®SMW200A generators use the same local oscillator (LO) signal. For this purpose, the internal LO signal from the primary R&S®SMW200A can be distributed to all secondary R&S®SMW200A generators in a daisy-chain configuration. Alternatively, the LO signal can be delivered by an external source, such as the R&S®SMA100B, and distributed to the R&S®SMW200A generators in a star configuration for optimal symmetry in the setup. Internal clock and trigger signals are also shared among the generators for synchronized operation.

The R&S®RF Ports Alignment Software together with the R&S®SMW-K545 option makes the complicated task of calibrating the simulator setup very simple. The user can access the alignment routines for multi RF port setups via a web GUI. All the user needs to do is configure the setup, define cables, couplers etc. for deembedding, connect each RF output to a vector network analyzer such as the R&S®ZNA or R&S®ZNB, and start the alignment. The R&S®RF Ports Alignment Software automatically collects correction data to align the RF paths in amplitude, group delay and phase (also over the entire I/Q modulation bandwidth) at a user-defined reference plane.

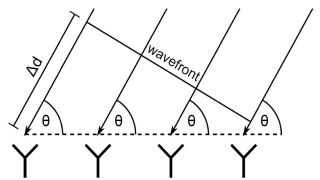
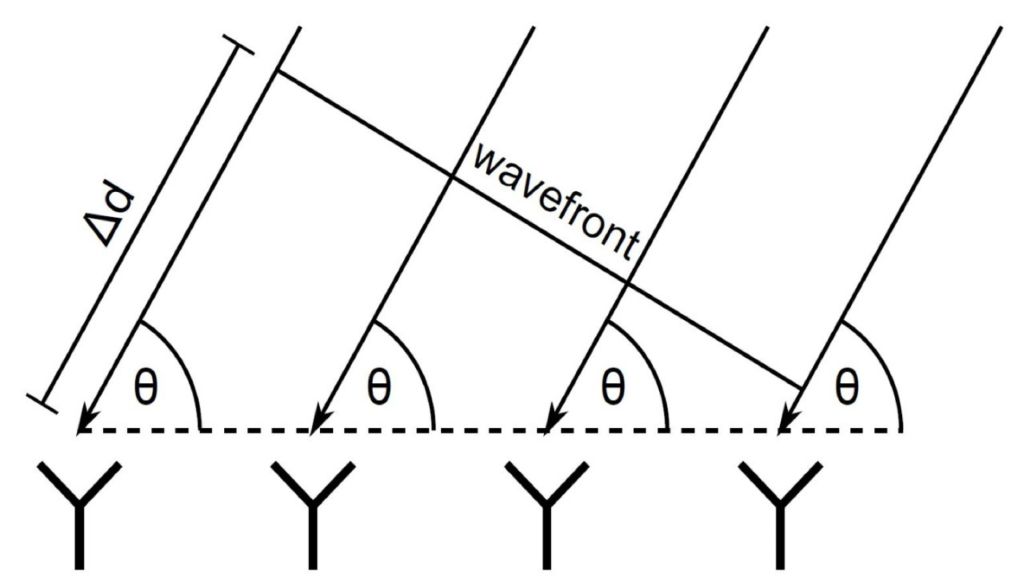
Fig. 3: Diagram showing how the angle of incidence theta leads to different phase shifts across a DF antenna array.
Ingrandisci immagine

Evaluating different direction finding algorithms

A typical test case during development is the evaluation and comparison of different DF algorithms. Relevant criteria for comparison are for example the angular resolution achievable with an algorithm or the impact of the SNR on the DF accuracy obtained with a given algorithm. In the following, an example scenario for testing a DF receiver with a linear four-channel antenna array is described.

The working principle of a linear DF antenna array is illustrated in Fig. 3. When a wavefront arrives at the array at an angle Θ, each antenna element will receive a version of the signal that is phase shifted relative to the other elements as the distance between the emitter and the antenna elements varies. Fig. 3 shows the difference in distance between the first and the last element in the array as Δd. The phase shifts between the antenna elements can then be evaluated by the DF algorithm to determine the exact AoA of the incoming signal.

The test setup for this example consists of two coupled dual-path R&S®SMW200A, providing four phase coherent signals as shown in Fig. 2. During scenario definition with the R&S®Pulse Sequencer Software, each of the four elements of the DF antenna array is assigned to one of the four ports of the R&S®SMW200A generators. Each generator RF port is then connected to the corresponding RF inputs of the DF receiver (DUT). When running the scenario on the instruments, all necessary amplitude, group delay and phase correction coefficients are automatically applied so that all four signals have the desired phase relationship at the RF inputs of the DF receiver. The R&S®Pulse Sequencer Software calculates the signals expected at the DF receiver RF input ports. Different scenarios allow evaluation of the DF receiver performance against a variety of requirements.

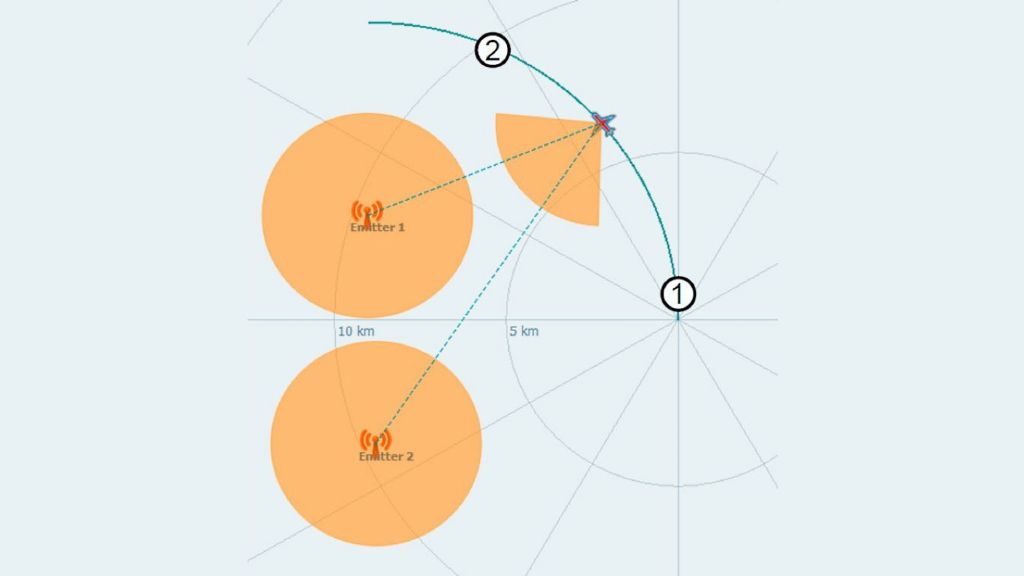
Preview of the direction finding scenario configured with the R&S®Pulse Sequencer Software.
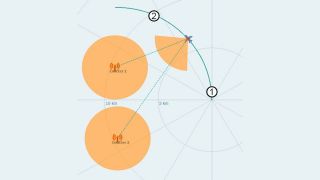
Fig. 4: Preview of the direction finding scenario configured with the R&S®Pulse Sequencer Software. In this example, the aircraft travels counterclockwise along a circular trajectory and passes positions (1) and (2). The linear antenna array of the DF receiver described in the example above is assumed to sit at a user-defined position somewhere in the wings or the body of the aircraft.
Ingrandisci immagine

Example use case

The following example shows how the R&S®Pulse Sequencer Software together with a calibrated simulator setup can be used to evaluate the performance of two different DF algorithms in the same DF scenario. In this example, real RF DF hardware and real RF signals are used.

Example DF scenario

An aircraft flies along a circular trajectory around two emitters (see scenario in Fig. 4). The aircraft is carrying a fourelement linear antenna array looking sideways which is used to determine the AoAs of the two emitter signals. As the aircraft travels along its trajectory, the difference in AoA between the two emitters gradually decreases, making the angles harder to distinguish from each other.

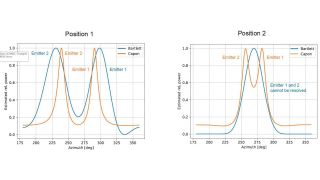
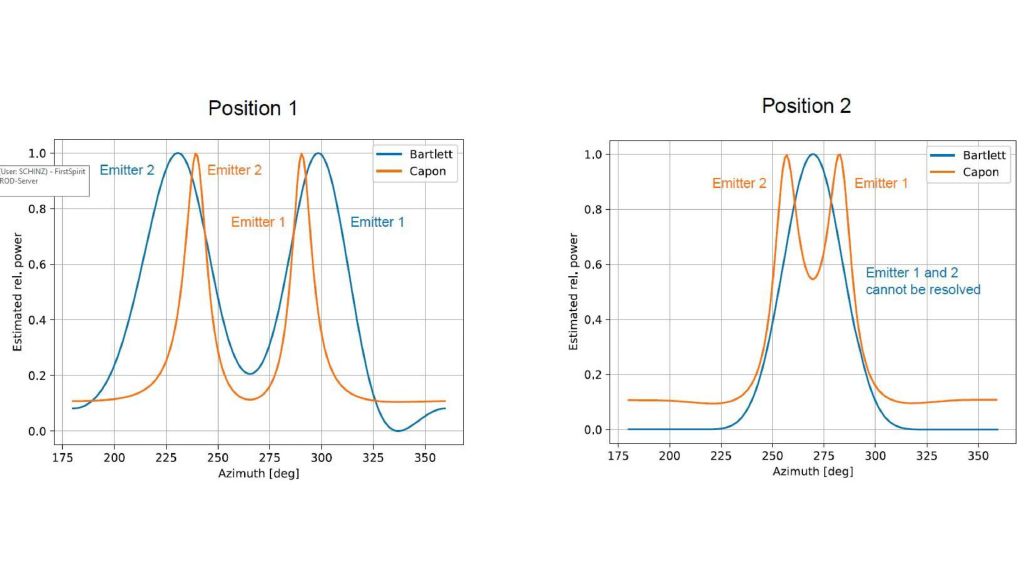
Fig. 5: DF results at different positions
Ingrandisci immagine

AoA estimation is performed by the DF algorithms programmed into the processing unit of the DF receiver. As an example, two different algorithms (Bartlett and Capon) are applied and their theoretical performance against the DF scenario is evaluated. Fig. 5 shows the angular estimation results delivered by the two algorithms at different positions of the aircraft carrying the DF receiver (DUT). The first bearing is taken at position (1) on the trajectory where the difference in AoA is still large. Both algorithms are able to distinguish between emitter 1 and emitter 2 and show accurate results. The second graph shows the results for position (2). The results indicate that only the Capon algorithm still provides accurate bearing estimates, while the Bartlett algorithm fails to resolve the emitters. This estimation only takes into consideration phase information and no other emitter characteristics.

Additionally, the DF accuracy (i.e. the difference between simulated and estimated AoA) can be evaluated for both DF algorithms. The following table provides a comparison of simulated and estimated AoAs:

Simulated AoA Bartlett Capon
Emitter 1 Emitter 2 Emitter 1 Emitter 2 Emitter 1 Emitter 2
290.0° 240.0° 298.3° 230.6° 290.4° 239.5°
280.0° 260.0° N/A N/A 283.3° 257.4°

This theoretical example of how a scenario is processed by different DF algorithms clearly demonstrates that it is essential to run a system test, including the RF hardware and the relevant DF processing algorithms, during development as early as possible.

DF scenario simulator from Rohde & Schwarz

The R&S®Pulse Sequencer Software in combination with multiple coupled and calibrated R&S®SMW200A generators provides powerful scenario simulation capability that makes it possible to simulate and generate many relevant DF scenarios with real RF signals with relatively little effort.

This enables the accurate characterization of direction finders against a variety of threat scenarios. The flexibility in DF scenario simulation makes the R&S®SMW200A together with the relevant software packages the ideal solution for this task.

Key benefits

  • Compact and scalable multichannel signal generator setup
  • Highly accurate, easy-to-handle alignment of amplitude, group delay and phase between multiple RF ports at a user-defined reference plane
  • Quick and flexible scenario generation with multiple emitters/interferers
  • High signal accuracy with 2 GHz modulation bandwidth
  • Simulation of 6 degrees-of-freedom (DoF) movements
  • Simulation of multiple simultaneous emitters