Written by Jens Berger | September 28, 2021


Real-field latency today involves an LTE network connected to servers worldwide. How does the geographical distance from the server impact transport times and latency jitter? A series of servers worldwide were contacted by mobile phones from different countries around the world to answer this question. To obtain realistic latency values, a data stream typical for real-time applications was emulated using the two way active measurement protocol (TWAMP) in line with IETF RFC 5753.
How was latency measured
‘Ping’ tests are often used to test latency. However, ‘ping’ uses a dedicated protocol that may not trigger resource scheduling in networks for real applications. For more realistic latency measurements, the TWAMP method was used to generate a data stream that emulates a real interactive application type by sending thousands of UDP packets with payloads to a reflecting server. This method has two clear advantages:
- The network perceives the packet stream as originating from a real application, UDP is the typical protocol for real-time services and with comparable packet sizes
- Instead of individual ‘ping’ results, the two-way latency is based on thousands of individual packet latencies for much more reliable statistics.
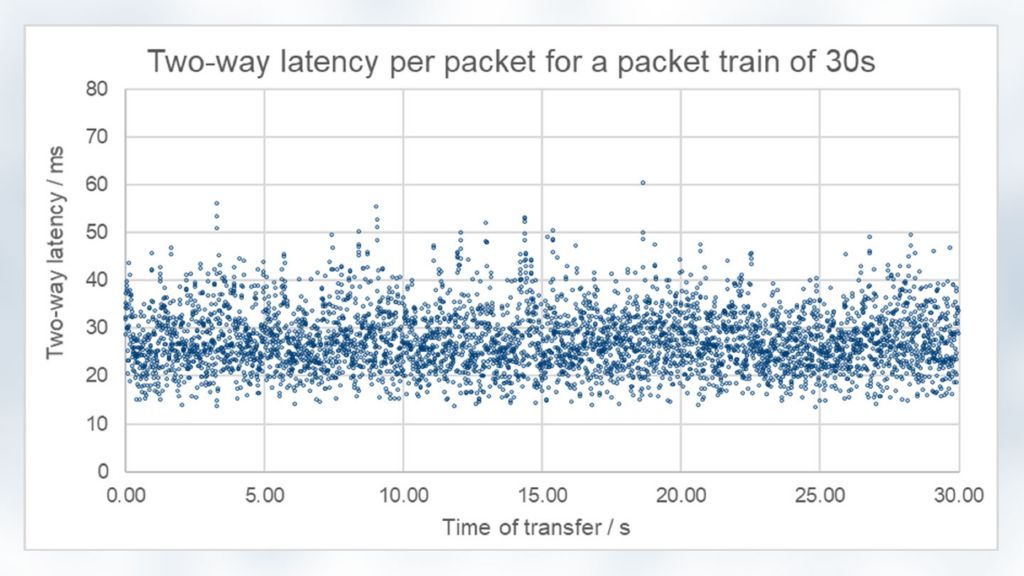
The following is an example of a fairly steady transmission. It covers a defined observation period of 30 seconds and each dot represents an individual UDP packet and its two-way latency or travel time from a smartphone through the LTE network to an internet cloud server and back.
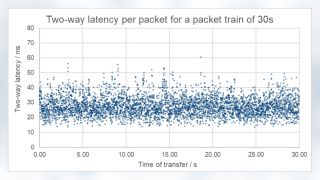
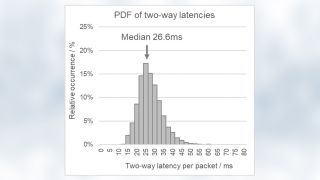
The figures clearly illustrate that latency is not constant for a given connection. During transport, packets are buffered and queued at several stages before travelling onward. The intermediate buffering is not just at the UDP level but also in transport blocks at lower levels. Every time the packet or a portion of it enters the next transport link, it may have shorter or longer wait before onward transport, just like waiting for a connection at a train station. The travel time for individual packets vary by queue status and intermediate waiting times. Some packets have almost no waiting times, while others may have ‘bad luck’ and wait longer at several stops before traveling onward, but most pass through with shorter or longer intermediate waiting times. The result is the average or mean latency.
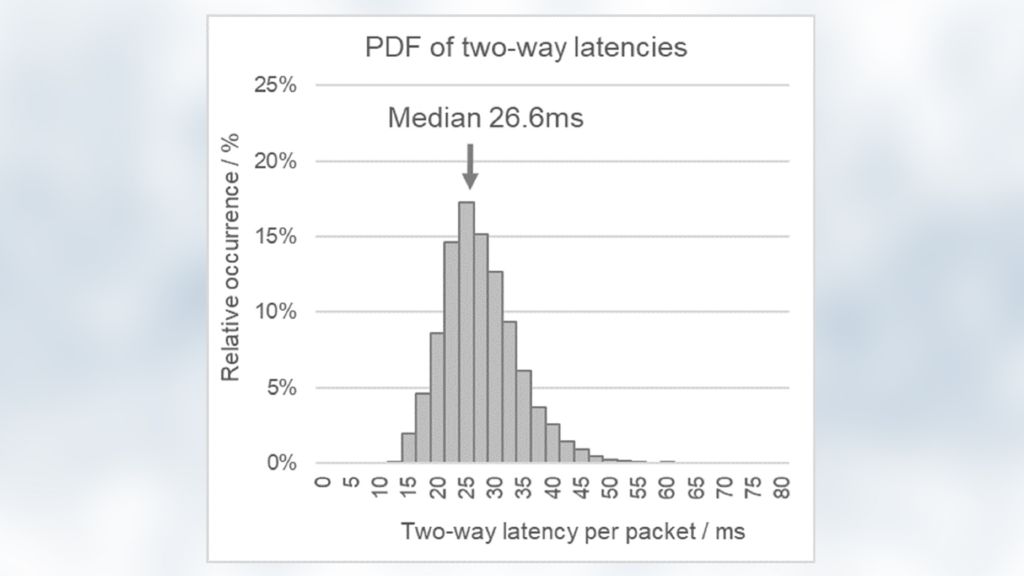
The distribution of two-way latency for packets in a 30 s packet train has a slight log-normal distribution. As expected, no packets are transported faster than the lower limit. This limit is dictated purely by the physical transport and the shortest possible length of all intermediate queues along the path. The majority of packets clearly have a latency in a narrow band above the lower limit but are much faster than those with the greatest delay, indicating that a simple average is not a good approximation for latency. The median gives a reliable indication of latency for most packets, while the 10th percentile is a reliable approximation of the shortest possible latencies in a connection setup.
However, the differences in transport times are as important as the median. A jitter indicator is needed to determine the distribution range. Packet delay variation (PDV) in line with IETF RFC 5481 is such an indicator.
How packet latency and delay variation depend on distance to web-server
Latency obviously depends on geographical distance to the server, but what about jitter delay variations?
Let’s start with latency using the median measured two-way latency for a packet over the observation period. Statistical evidence requires a series of about fifty measurements from each client location to each server. The measurements at each location are conducted using smartphones on different local mobile networks to average out mobile connection differences. Each symbol in the diagram stands for a smartphone client location connected to one of the servers. The measurements across all tested local networks were averaged for the individual locations. Servers were used in North America, South-East Asia, the Middle East and Europe.
There is a clear correlation with geographical distance. A spread is also apparent between the distance on the x-axis for the plain straight-line distance, while actual connections used existing fiberoptic or coax cables.
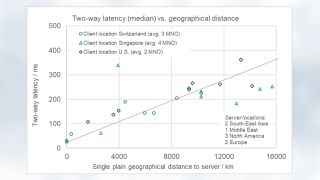
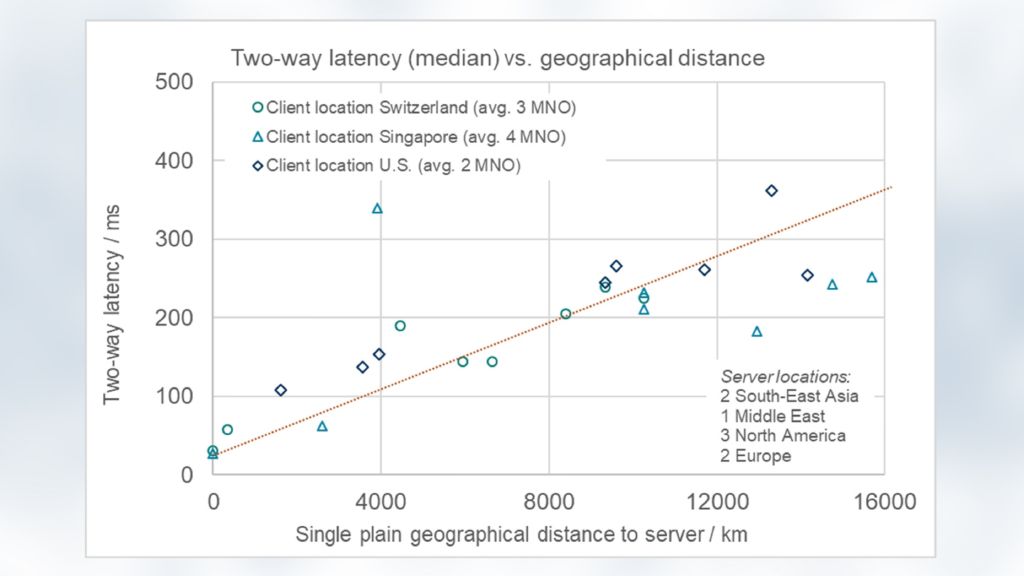
Latency is not the same for each packet and the median value shows a clear link between latency and travel distance. In real-time applications, delayed arrival of individual packets can be crucial, making packet delay variation (PDV) another important metric.
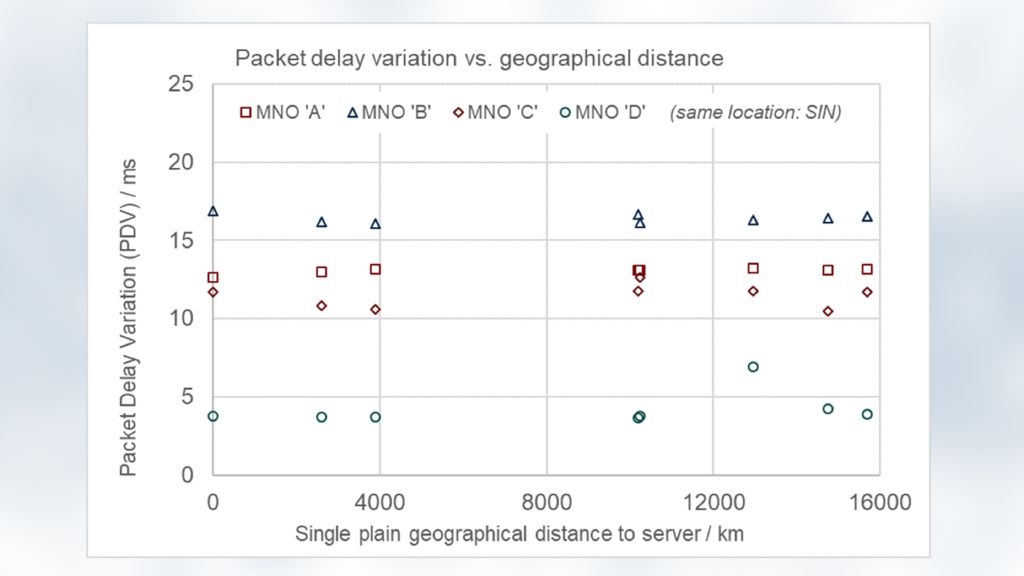
The following chart presents the average PDV for four operators at the same location with an LTE connection to different servers. Each symbol shape represents a different mobile network operator.
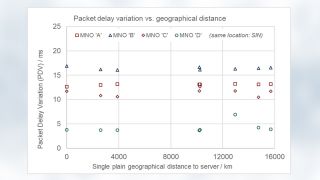
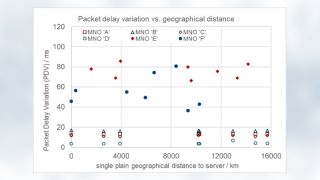
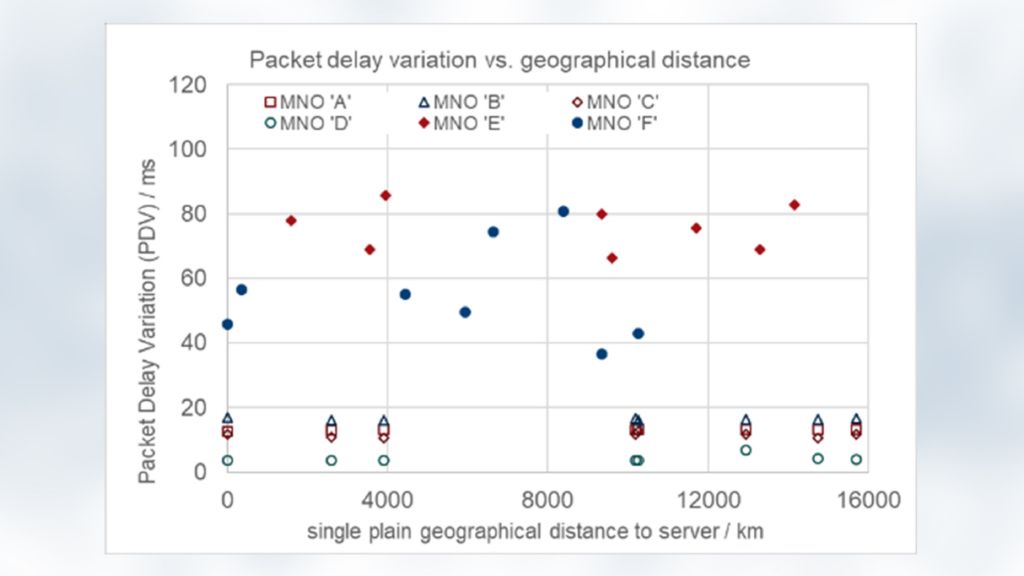
Packet delay variation clearly does not depend on the distance to the server or on the number of nodes and hops in a long-distance connection. The PDV is solely determined by the local mobile network.
The geographical distance to the far-end server or client determines absolute latency. In current LTE networks, latency ranging from 20 to 30 ms is realistic for connections to a local web-server over a distance of a few hundred kilometers. Current 5G EN-DC networks already enable lower latency to local web-servers of 12 to 15 ms if uplink and downlink use 5G carriers. The shorter and more quantified the latency, the more important distance to the server becomes.
However, the distance to the server can be greater in relative comparisons between networks and quantified delay variations. Higher base latency is present but delay variations and differences between networks and operators generally remain the same, since they are defined by local networks where distance to the server plays practically no role.
Latency and interactivity test with Rohde & Schwarz QualiPoc Android
The Rohde & Schwarz interactivity test is based on the TWAMP method and is supported by QualiPoc Androi software as part of the suite for data performance testing.

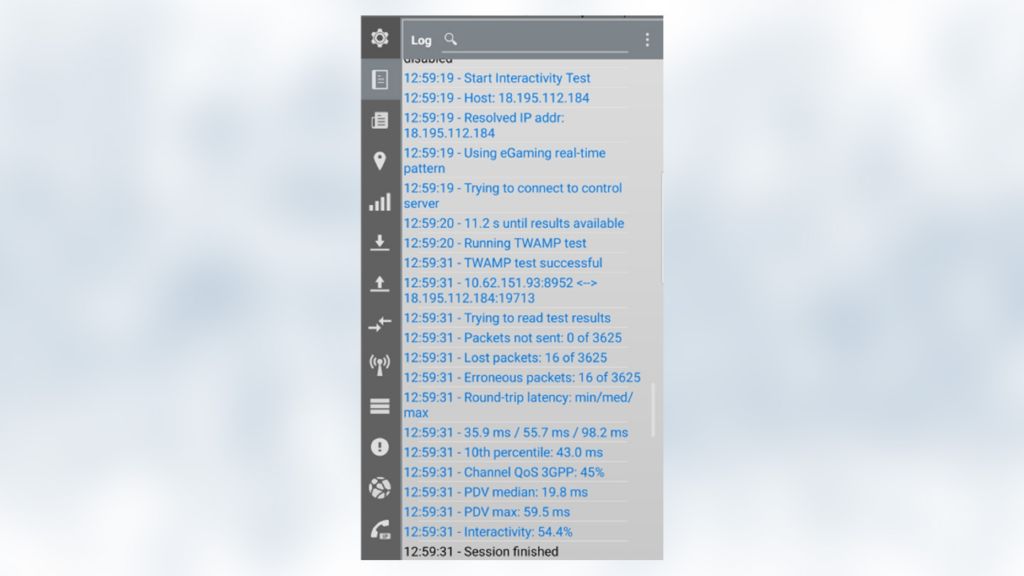
The test provides details for each packet but also detailed statistical measures to qualify transport. Finally, the algorithm emulates the behavior of a specific service – such as real-time gaming – aggregates all the results in the observation period, considers losses and discarded packets and scores the perceived interactivity for the emulated scenario in an interactivity score. All Rohde & Schwarz MNT post-processing and reporting solutions support measurement result analyses and presentations.
The measurement approach is under discussion in ITU-T in draft G.IntAct and reflected in the publicly available ETSI TR 103 702.
Read more about interactivity test in part 1 - 8 of this series and download our white paper "Interactivity test":
Interactivity test: QoS/QoE measurements in 5G (part 1)
Interactivity test: Concept and KPIs (part 2)
Interactivity test: Examples from real 5G networks (part 3)
Interactivity test: Impact of changing network conditions (part 5)
Interactivity test: Packet delay variation and packet loss (part 6)
Interactivity test: Dependency of packet latency on data rate (part7)


