Measure noise spectral density with oscilloscopes

Noise spectral density (NSD) describes the amplitude of random noise per bandwidth unit of a signal. NSD is expressed as a voltage value divided by the square root of frequency and is similar to power spectral density (PSD) which equals power of the noise per Hz. An oscilloscope with a high resolution FFT engine and flexible math channels can be used to extract NSD directly from a time domain acquisition, without a separate spectrum analyzer or a dedicated noise figure instrument.

RTO6 Series

Your task

In modern RF, mixed-signal and high-speed-digital designs, the quietest part of a system often ultimately determines its performance – whether receiver sensitivity, the jitter floor for a clock distribution network or the electromagnetic compatibility (EMC) margin for a power converter. Noise spectral density (NSD) quantifies the amount of noise (typically measured in volts) divided by the square root of the frequency, giving engineers a frequency resolved view of noise distribution across the spectrum.

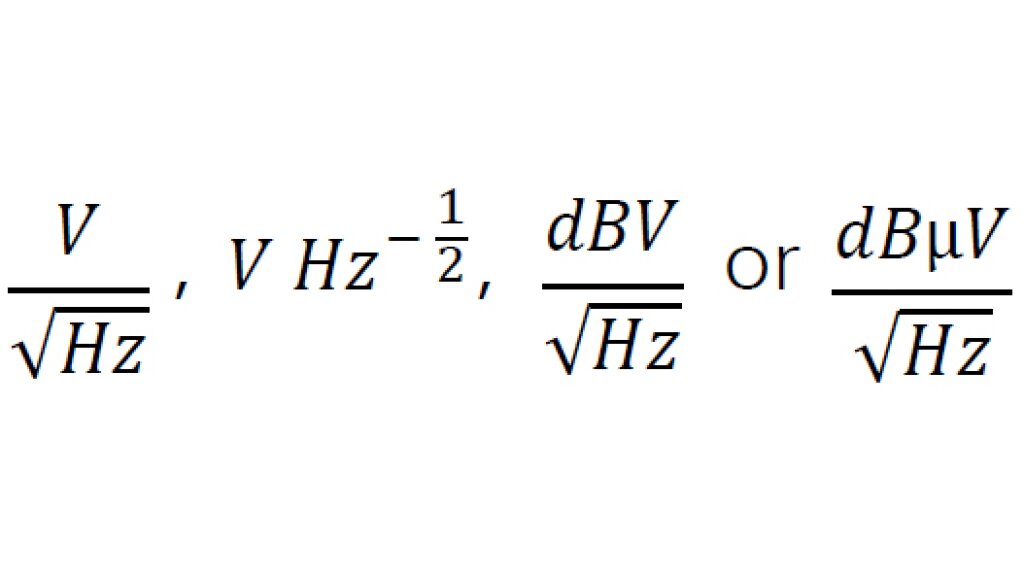
Typical measurement units are:

Formula 1
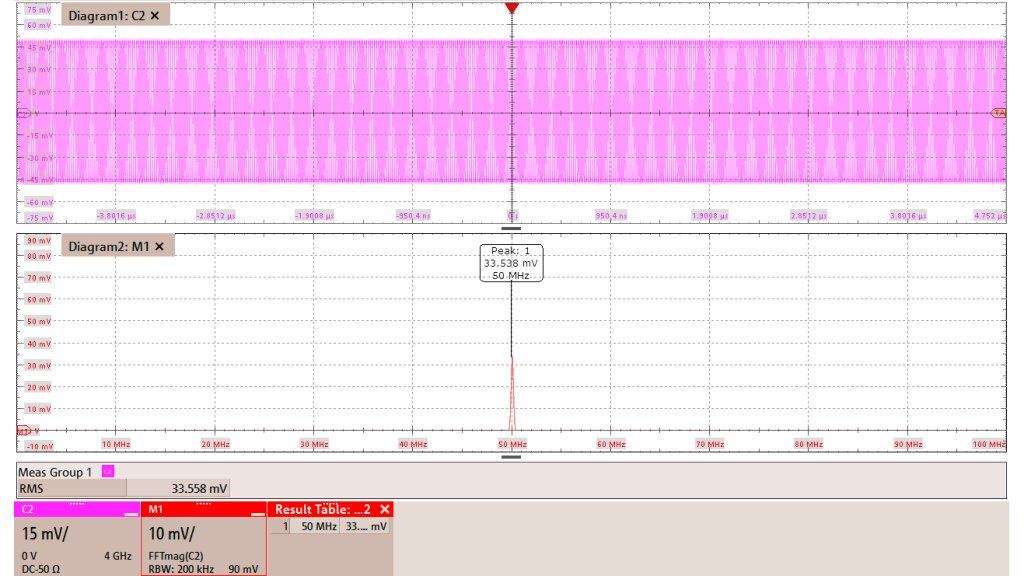
Fig. 1: FFT math channel is correct
Fig. 1: FFT math channel is correct, RMS in time domain = energy in frequency domain

Rohde & Schwarz solution

The R&S®RTO6 and R&S®RTP NSD can make spectrumbased measurements. A versatile math channel is available when an oscilloscope has no dedicated NSD function. Our example uses R&S®RTO6 and R&S®RTP oscilloscopes. The FFT for the oscilloscope is essential when transforming the time domain signal to the frequency domain

V(t) → V(f).

Parceval’s theorem is quick way to verify signal correctness: The energy in the time domain must be the same as the one in frequency domain. Here, the RMS value of the sine wave in the time domain equals the peak height in frequency domain (technically other frequency bins contribute, but the noise is minimal here).

Math channel with formula for NSD
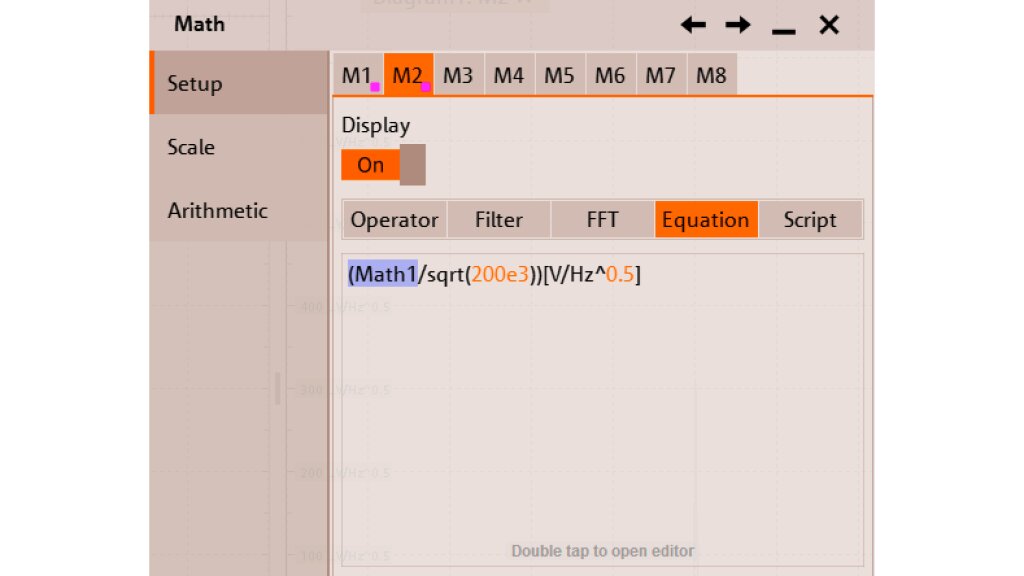
Fig. 2: Math channel with formula for NSD

To proceed further, the FFT math channel will be used by a second math channel. V(f) (Math1 channel) is divided by the square root of the resolution bandwidth (RBW) 1). In this example the RBW is 200 kHz, so the math formula for M2 is shown in the figure at the right.

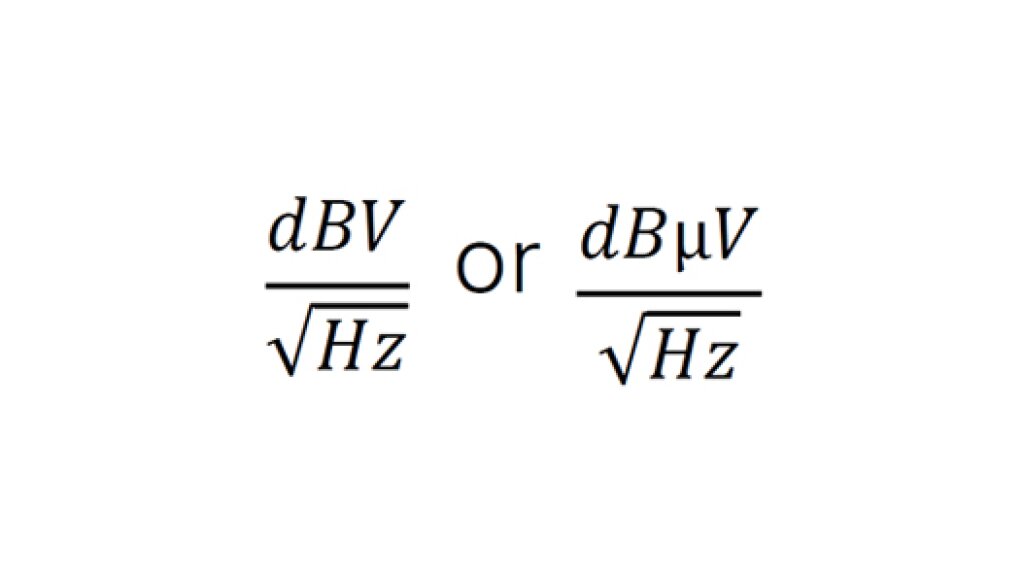
Sometimes other units are better for representing the signal, especially logarithmic displays in:

Formula 2
Formula 2
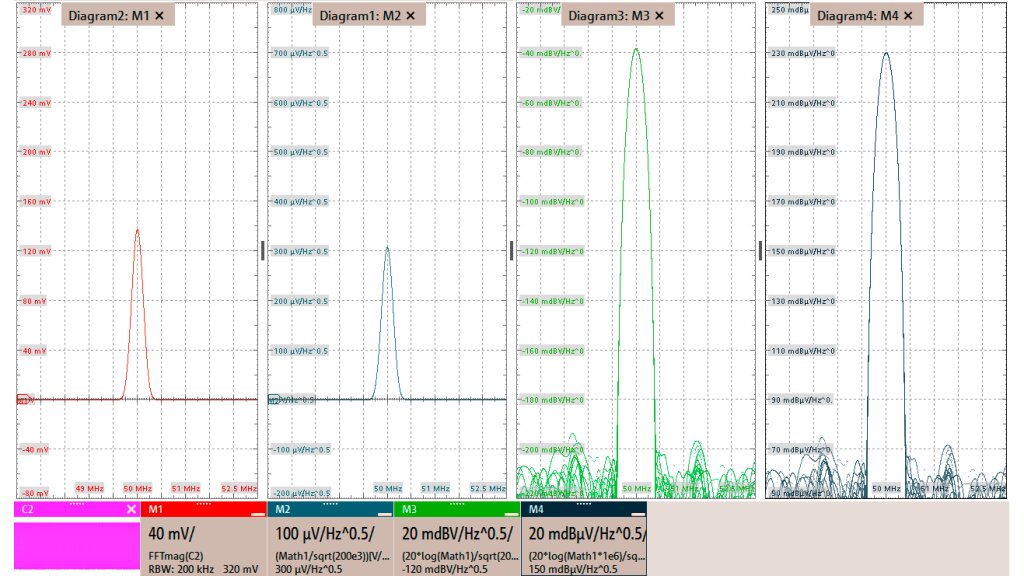
Several units and display for the signal and its NSD
Fig. 3: Several units and display for the signal and its NSD

This is easily possibly by adjusting the formula to:

dBV: (20*log10(Math1)/sqrt(200e3))[dBV/√Hz]

dBµV: (20*log(Math1*1e6)/sqrt(200e3))[dBµV/√Hz]

The results of the various formulas are shown in the figure at the right.

Summary

Versatile math channels turn any R&S®RTO6 and R&S®RTP oscilloscope into a full featured NSD analyzer, even though the instrument has no dedicated NSD menu item. By normalizing the FFT magnitude with √RBW, a true voltage density metric can be obtained. Finally, a single math expression can switch between linear or logarithmic units (see Formula 2), presenting the result according to user preferences.

The Rohde&Schwarz oscilloscopes’ built in math engine supports the user with accurate and repeatable NSD results using the same hardware that was used for time domain work.

Benefits:

  • Full band insight: capture low frequency 1/f noise and high frequency spurs in a single sweep
  • Real time verification: correlate time domain event (e.g., switching edges) with their spectral contribution
  • Cost effective: leverage existing test equipment; no extra hardware required

リクエスト情報

Do you have questions or need additional information? Simply fill out this form and we will get right back to you.
For service/support requests, please go here to log in or register.

マーケティング・パーミッション

お問い合わせ内容が送信されました。 後ほどご連絡致します。
An error is occurred, please try it again later.