Written by Arnd Sibila | January 17, 2019
The ultimate questions concern the values the MNO wants to convey to the market and how the results can be used to improve network performance. Is producing a marketing claim (“best in xyz”) the score’s key objective, or should the score’s methodology provide drill-down possibilities and offer insight into root causes to initiate actions for improvement?
Regardless of the MNO’s intention, the prerequisite for both is the same: First, the right metrics describing the network’s overall performance; and, second, transparent measures to derive all details of potential problems to improve network performance efficiently.
The right metrics describe overall performance, and transparent measures derive the necessary details for improvements.
Mobile networks are rapidly evolving, and their data transport capacity has grown immensely over the last years. At the same time, the data consumption of apps and services and customer expectations about mobile data usage have increased drastically.
Because of continually evolving networks, the situation in the field is a very heterogeneous one. In dense areas and during peak hours there is not enough capacity, despite full 4G coverage. In the countryside and rural areas, 2G base service is available along with existing 3G/HSPA cell sites. The technology distribution by itself will not convey anything about performance.
An integrative network performance score
The performance of a service is not only determined by the transport capacity of the radio link. There are also the cell-site connections to the core network and the interconnectivity to the content delivery network and servers. It is essential where and how content servers are placed and connected in the network and how the content management and caching is organized.
To get a true view of a network’s performance, the actual service performance as perceived by the end user needs to be considered. Optimal network performance can only be achieved when all elements are in tune with each other. Therefore, when targeting focused investments for maximum benefit, the solution should include finding the bottleneck rather than investing aimlessly as in “the more, the better.”
An integrative metric must be independent of technology and consider everyday applications.
This requires an integrative network performance metric that entails much more than a pure data speed meter. An integrative metric must be applicable independent of technology, and it must consider real applications we all use extensively. The metric needs to be based on a transparent method with which exact weak spots and underlying root causes of non-optimal performance can be pinpointed.
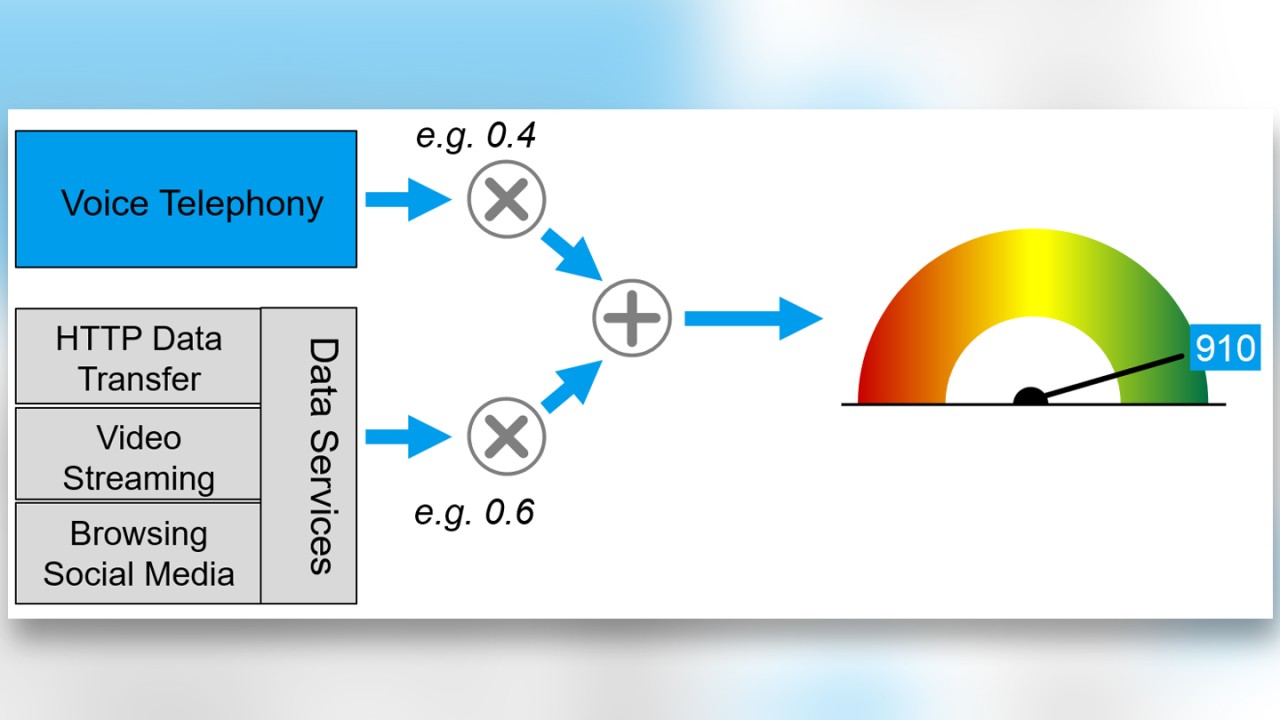
A score targeting the entire network performance must rely on the services used by the end user. First, the network performance score must consider telephony and data services; particularly for the latter, there are many popular services around. Most data services are based on HTTP or at least TCP file transfer; however, they differ in how they use the infrastructure. There are:
- simple download services; for example, to update apps or maps;
- upload services; for example, to upload images or videos to social media platforms;
- more complex services where multiple connections are opened and completed over time, as is the case with most service apps;
- streaming services (predominantly video) that require continuity in data delivery.
Finally, the quality of these services’ different aspects and challenges to the infrastructure comprises the network’s overall performance. Consequently, an integrative scoring method must consider and rate these different aspects.
ETSI-initiated integrative scoring method
Many operators have acknowledged the lack of a transparent and integrative scoring method. Therefore, the globally renowned European Telecommunications Standards Institute (ETSI) has initiated a dedicated work item to study and describe a methodology for an integrative score to assess the overall network performance. In August 2019, ETSI released the technical report TR 103 559 which defines the best practices for network QoS benchmark testing.
The description of a logical and multilayer model has been described and introduced. At the lowest layer, the model measures key performance indicators (KPIs) for common services such as telephony and data services, including web browsing, file downloading, social media and video streaming.
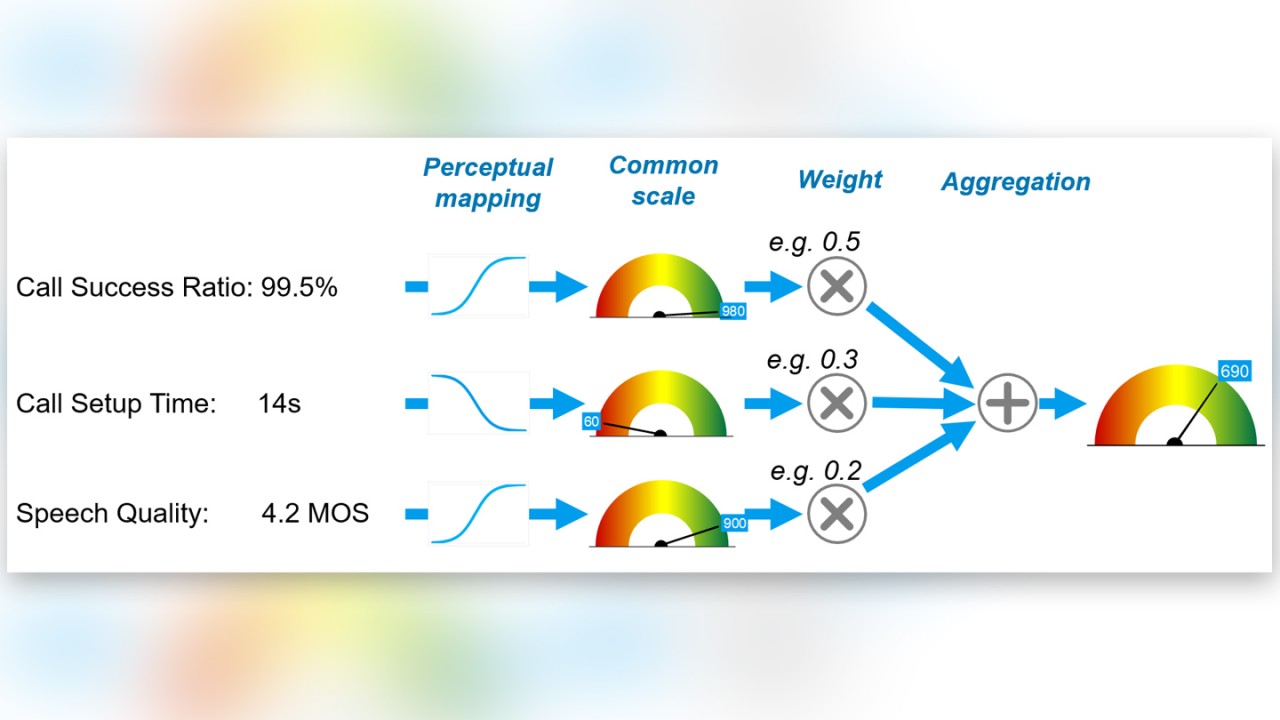
In a first step, these technical KPIs are transformed into a common, comparable metric to aggregate them to a “per service” performance. This scaling also considers saturation in perception, meaning that it makes no sense to report the differences in a technical performance where the difference is not perceived.
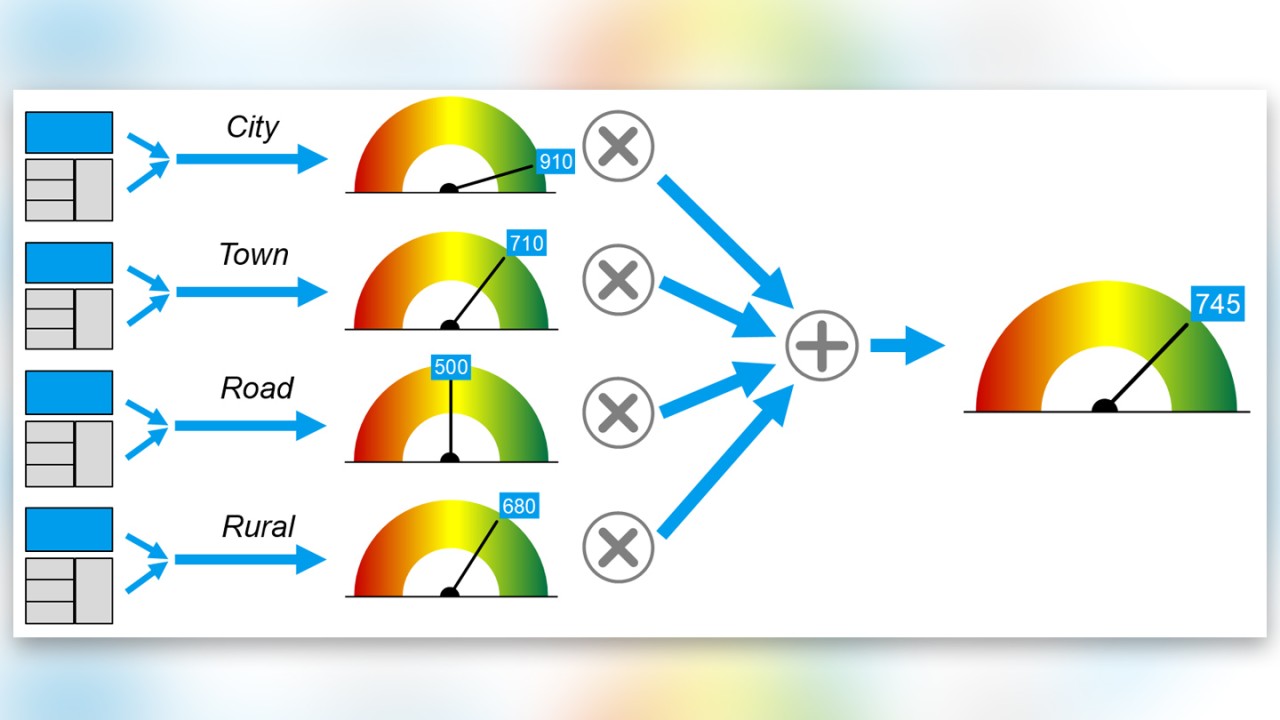
These “per service” performance figures are then further aggregated by certain weights and aggregated to a score describing the network’s performance, for example in an individual region. These regional performance scores can be weighted again, for example by population density over all regions, and aggregated to an overall score for the whole network.
The multi-step aggregation also enables efficient drill-down possibilities. A non-optimal amount of points can be easily broken down to a certain region, dedicated application, radio technology or a specific end-user activity.
How to derive a “per service” performance
The precondition for such a scoring methodology is the integrative QoE evaluation of service classes, particularly the combination and weighting of different dimensions for one service class are essential. The voice service class, for example, has three dimensions and the QoE for voice is determined by the following:
- Can the user receive service and maintain it? (e.g. call setup success ratio, call drop ratio)
- How long does it take to receive service? (e.g. call setup time)
- How should the quality of the received service be evaluated? (e.g. speech quality)
Each of the three dimensions has an impact on QoE and should have its weight.
Today’s difficulty lies in the rating and integration of individual dimensions using individual scales and metrics. Consequently, the three voice call dimensions should be transformed to a common scale (e.g., 0 to 1000) that also sets the boundaries to determine a saturation in perception. Once the performance of these dimensions is transformed to a common scale, they can be weighted and aggregated to a single score describing the service’s performance.
The transparent and integrative scoring methodology, as initiated by ETSI, aims to evaluate all services and applications separately and in line with the same multi-dimensional concept. In the end, the performance numbers for each service class are weighted again and aggregated to an overall score describing the network’s performance in the particular region where measurements were made. Finally, the regional performance can be weighted by importance (e.g., population density) and combined to an overall score (e.g., countrywide).
Maximized QoE via an optimized network
This scoring methodology together with the details from the multi-dimensional QoE evaluation, including the perceptual impact, provide a guideline for MNOs to optimize their networks effectively. Knowing the actual vs. the maximum achievable points per test category/service/region/technology etc. provides insight into potential and concrete areas for network optimization.
This is especially important since resources and investments for network optimization are often limited. Knowing what to optimize exactly and how to achieve the most significant improvements gives mobile network operators a competitive edge. In essence, the standardized Network Performance Score (NPS) methodology is the glue between benchmarking campaigns and targeted network optimization activities.
Find more information about the NPS on our dedicated web page.


