Stability analysis of DC/DC converters in the frequency domain
With a Rohde & Schwarz oscilloscope

With a Rohde & Schwarz oscilloscope


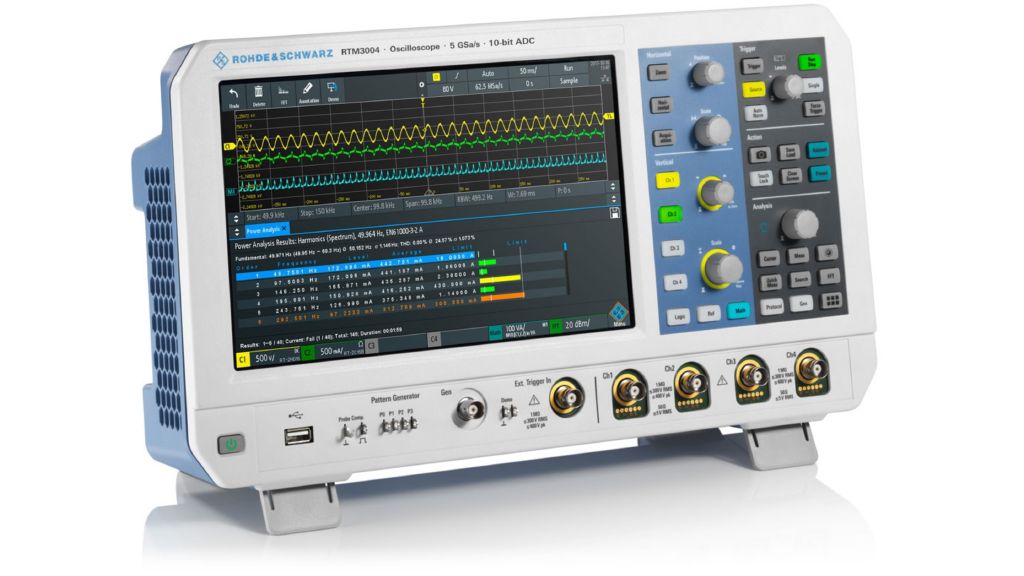
You need to determine the stability of electric power circuits as parameters change due to aging or temperature changes. Frequency response analysis is an important tool in circuit design and verification. Various measurements such as power supply rejection ratio, component impedance and open loop gain help you judge the overall stability. Typically, a low frequency vector network analyzer is used. An oscilloscope like the R&S®RTM3004, usually part of laboratory equipment, can also accomplish these measurements.
Easily and quickly analyze frequency response analysis on your oscilloscope with the R&S®RTx-K36 frequency response analysis (Bode plot) option. The R&S®RTx-K36 option uses the oscilloscope’s built-in waveform generator to create stimulus signals ranging from 10 Hz to 25 MHz. Measuring the ratio of the stimulus signal to the output signal of the DUT at each test frequency, the oscilloscope logarithmically plots gain and phase.
The dynamic range of the R&S®RTx-K36 based on a 0 dBm input signal is typically > 70 dBc with an amplitude noise < 1 dB and a phase noise < 5°. To achieve this dynamic range with the 10-bit ADC of the R&S®RTM3000 oscilloscope, broadband noise is removed using the filtering and averaging capabilities of the discrete Fourier transform.


Control loop measurement
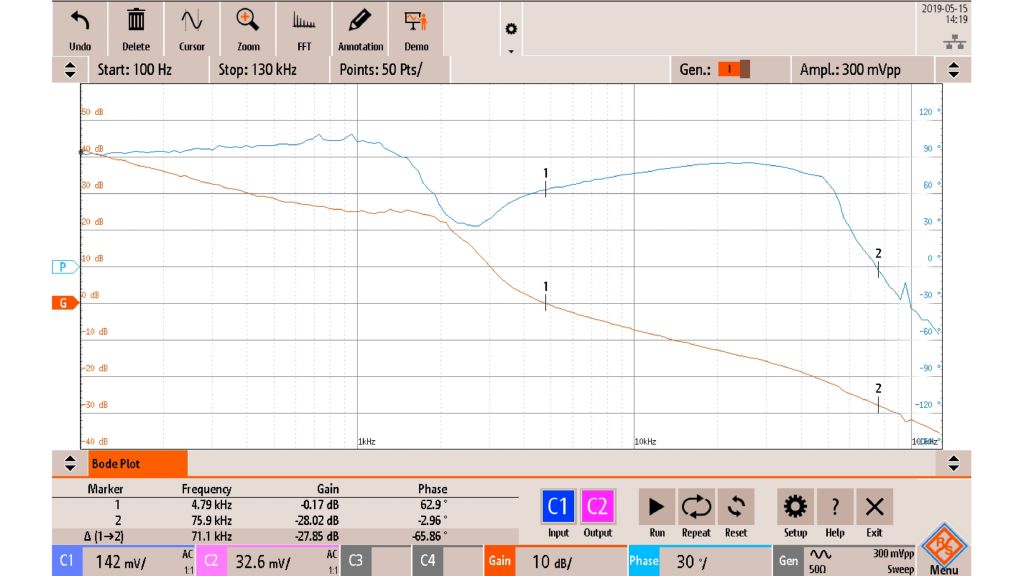
Here, the control loop of a DC/DC buck converter has been measured with an R&S®RTM3004 oscilloscope with installed Bode plot option. The generator signal is injected via a transformer into the feedback loop of the converter and the signal is measured at the injection location (CH1) and the output (CH2).


Control loop measurement on a DC/DC buck converter using the R&S®RTM3004 oscilloscope with R&S®RTx-K36 option installed
Measurement results
As displayed in the screenshot at the top of the next page, the open loop gain (red curve) decreases nearly monotonically as the frequency increases. The open loop phase (blue curve) shows non-monotonic behavior that is caused by a too large electrolytic capacitor at the output of the buck converter.
Traditionally, the frequency response is measured with a dedicated low frequency vector network analyzer (VNA). To compare the measurement results of the R&S®RTM3004 oscilloscope, an identical measurement was performed with a low frequency VNA and the R&S®RTM3000 series oscilloscope.
The comparision below show that the analysis with the R&S®RTM3004 matches very well the analysis with the low frequency vector network analyzer.
Engineers use oscilloscopes as a primary measurement tool to test and characterize electrical circuit designs. Especially in power supply applications, development engineers usually analyze the frequency response with a dedicated extra device, the low frequency VNA. The R&S®RTx-K36 frequency response analysis (Bode plot) option for the R&S®RTM3000, R&S®RTB2000 and R&S®RTA4000 oscilloscopes performs frequency response analysis with similar accuracy.
With their low noise frontend and the built-in wave generator, these oscilloscopes ideally meet frequency response analysis task requirements and provide a cost-optimized alternative to dedicated standalone low frequency network analyzers.

