



Written by Anna Llagostera | May 26, 2026

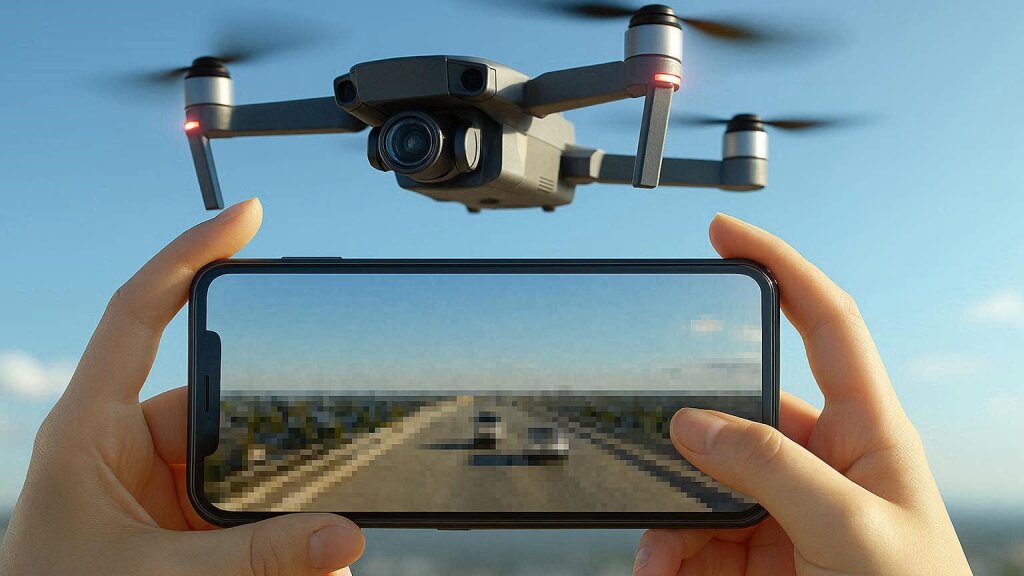
We recently ran a project along specific routes to verify whether certain (public) mobile networks have sufficient performance to operate drones and transmit from them high-quality, real-time video. The resulting network traffic was a high-quality video stream in the uplink direction (drone-to-operator, UDP-based with no re-transmission) together with some control data in the downlink (operator to drone). The UDP upstream traffic was roughly estimated to be between 10 and 20 Mbit/s.
Our portfolio includes the UDP Capacity and UDP Stream tests, which are suitable for such assessments.
UDP Capacity test
First, we measured network capacity along the routes of interest to check whether the maximum capacity (throughput) was greater than the network traffic needed to transmit high-quality video from drones.
Two state-of-the-art, high-performance smartphones served as test probes, each one with a SIM card from a different operator. The responding data server emulates the operator and was placed on the internet well-connected to the mobile networks. Our UDP Capacity test measured the available capacity in the two mobile networks, and it was much higher on average than the bandwidth needed for 20 Mbit/s uplink video streaming (see the picture below).

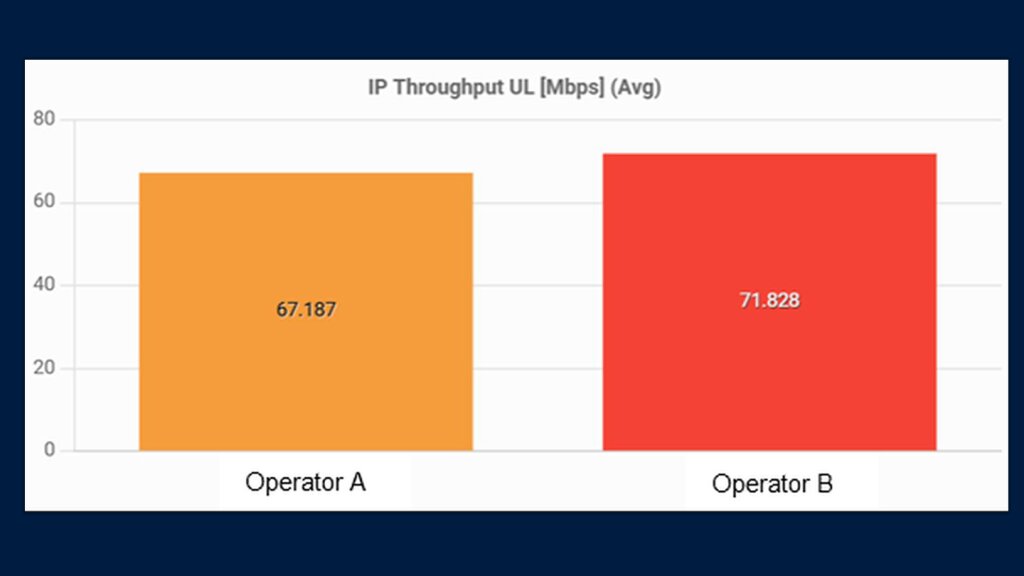
Even though the two networks appeared to be up to the task, averaging meant locations along the route might not achieve the necessary 20 Mbit/s while others with excess bandwidth might compensate for the weak areas.
UDP Stream test
The UDP Stream test differs from the UDP Capacity test. UDP Capacity converges on the highest possible data rate while UDP Stream sends a pre-defined data rate regardless of whether enough transport capacity is available. If a network cannot transport the defined bitrate, the non-transmitted packets are not received (lost) and the measured throughput is lower than the send rate. The UDP Stream test also measures the two-way packet delay for each sent packet. Thus, we can emulate the actual video traffic and see if packets are lost or heavily delayed.
Here we used a bi-directional UDP Stream test to emulate the drone transferred data, with 20 Mbit/s send rate in uplink (video) and a ten times lower send rate in downlink (control traffic). Short 10 second tests were conducted one after the other, while driving around the area of interest.
The results from the UDP Stream test showed that in the uplink direction (emulated video stream) many of the transmitted packets were lost (3% for operator A and 1.7% for operator B). Even with an average result, the problem is immediately apparent.

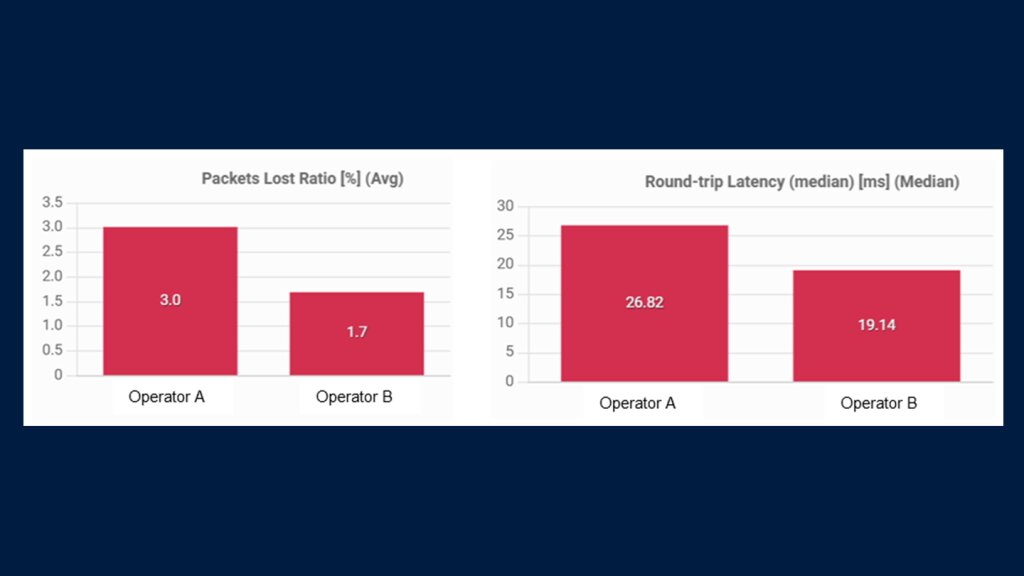
Such packet loss is acceptable when retransmitting lost packets as in TCP or QUIC but is clearly perceptible for real-time UDP video, where the user (drone operator) would see artifacts that might impair their actions.
Please note: In practice, high resolution video frames are split into multiple UDP packets. The loss of one packet will mean a missing frame regardless of whether the other packets are received. The number of discarded packets for a real-time video application can be higher than the measured lost packets in this test. On the other hand, the video receiver may also use interpolation techniques to conceal missed individual video frames.
UDP Stream test results help determine whether connectivity is sufficient for the targeted services. However, the actual impact of low packet loss on perceived quality must be measured by using the real video service.
Median round-trip latency (the time for a packet to travel from client to server and back under this network load) is also shown above. The value is also higher for operator A than for operator B, even though both median values would probably be enough for real-time uplink video transmission. Here, median values reduce the impact of highly delayed packets on latency results.
Geographical visualizations
The plots below show the geographical results for operator B, which has very few locations with IP maximum throughput (capacity) in the uplink below 20 Mbit/s (left). In contrast, many more locations show packet losses (middle) and higher latency values (right) for the actual transmitted 20 Mbit/s UDP stream. Note that UDP Capacity and UDP Stream measurements were not done in parallel to avoid misleading results, since the capacity tests would saturate the networks under test.
Operator B:

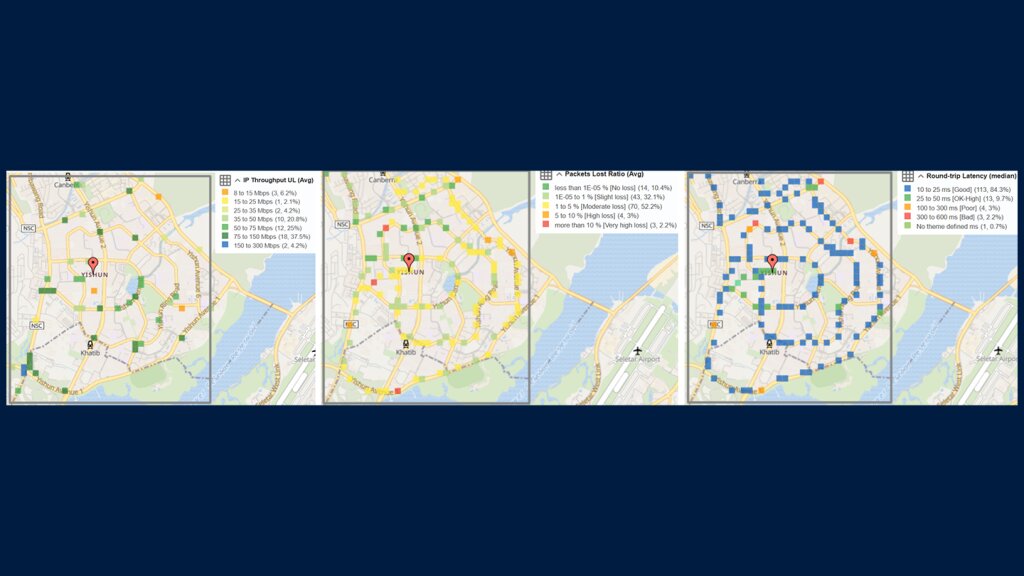
Below, a similar pattern is visible for the slightly poorer performing operator A: few locations with insufficient IP capacity, and more points showing lost packet and latency issues. The latency differences between the two operators are clearly visible in the right plots: operator B (top) has a round-trip latency of less than 25 ms on most tests, while operator A (bottom) has mainly round-trip latency between 25 and 50 ms.
Operator A:

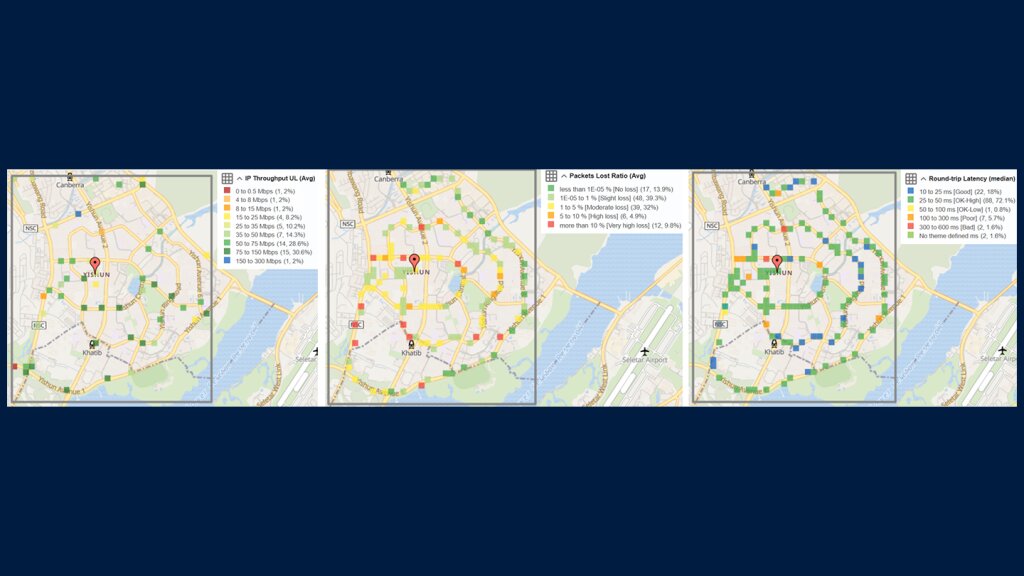
According to the UDP Stream test results, packet losses would be present in several locations when performing the target high-quality real-time video transmission task.
Drilling down into a particular example
To better understand the difference between UDP Capacity and UDP Stream testing, we selected a UDP Stream test from operator A, with 10% of packets lost and 16.7 Mbit/s average throughput. Lost packets (vertical red bars) and measured round-trip latency for each received packet are shown on the left, while the average achieved throughput per one-second interval is depicted on the right. Results are shown for both the uplink (red) and the downlink (green) directions.

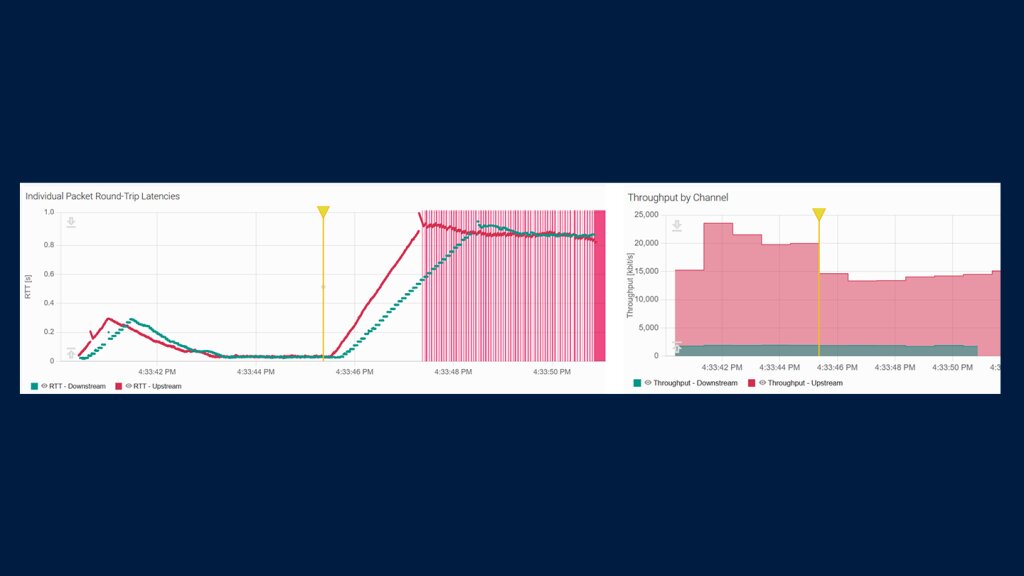
In the first second of the test, the uplink IP network capacity (~15 Mbit/s) is not sufficient to absorb the send rate of 20 Mbit/s and the two-way latency increases (two-way latency and congestion can be seen in both the uplink and downlink tests but with only a slight delay in the downlink). Starting on second 2, uplink channel capacity is greater than the required send rate and the round-trip latency is progressively reduced. In the third section (after the yellow marker) capacity is once again insufficient (~15 Mbit/s), and two-way latency increases to around one second, filling the buffers and causing packets to be discarded (see vertical red bars in the left plot).
The example shows how the dynamics in network capacity are crucial when determining the lost-packet and latency success for a particular UDP stream transmission (more so than maximum capacity).
Discussion
Note that this test case is very sensitive. Missing the data transport capacity (lower bitrate) for a certain duration will result in lost packets.
The UDP Stream test is much more accurate and more efficient when assessing network performance than a simple UDP Capacity test when a task relies on regularly sending UDP packets.


