Written by Anna Llagostera | October 26, 2023
Multidimensional quality analysis with ITU-T P.863.2
Several algorithms were developed over the past decades to assess the perceived quality of speech signals as a human would. The current ITU-T Recommendation P.863 'POLQA' is the most successful and accurate standard among them.
The overall speech quality assessments in line with ITU-T P.863 'POLQA' can be broken down into various quality dimensions. The new ITU-T P.863.2 recommendation standardizes four dimensions of speech quality for added diagnostic insights.
The four ITU-T P.863.2 quality dimensions are:
- Discontinuity: Evaluates the speech fluidity, which is impaired by time-related degradations, such as interruptions, packet delay jitter, frame losses and low-bitrate coding.
- Coloration: Quantifies frequency response distortions, such as bandwidth limitations and codecs.
- Noisiness: Assesses noise-related distortions, such as noise floor, environmental noise and modulated noise (e.g. quantization noise).
- Sub-optimum loudness: evaluates the impact of sub-optimum playback level on perceived speech quality.
A single perceptual dimension can be impacted by many technical factors. Discontinuity may result from interruptions, but also from packet losses and concealment and even from time-varying background noise. Coloration might be caused by a narrowband codec, but also by band limitations on the send-side or receiving-side terminal device or even by the network media processing.
ITU-T P.863.2 contains four dedicated objective prediction models to assess each of the quality dimensions. The four models build on the ITU-T P.863 'POLQA' model and use its internal parameters.
P.863.2 quality dimensions are evaluated with a MOS scale of 1 to 5, where 5 is excellent and 1 is bad.
Relevance of P.863.2 quality dimensions in mobile network testing
Two ITU-T P.863.2 quality dimensions are especially relevant for mobile network testing: discontinuity and coloration.
P.863.2 noisiness has limited use in automated field tests, since test connections in drive test scenarios are mainly noise free. Current mobile devices or networks rarely insert noise into the channel.
P.863.2 sub-optimum loudness is mainly designed for device testing. In automated mobile network testing this dimension is less interesting, since speech signals are usually aligned to the nominal level at the insertion point and after audio capturing on the receiving side.
P.863.2 discontinuity
In mobile networks, degradations that impact P.863.2 discontinuity are mainly caused by the channel, such as interruptions, packet delay jitter or frame losses. Low-bitrate coding also has an impact on P.863.2 discontinuity.
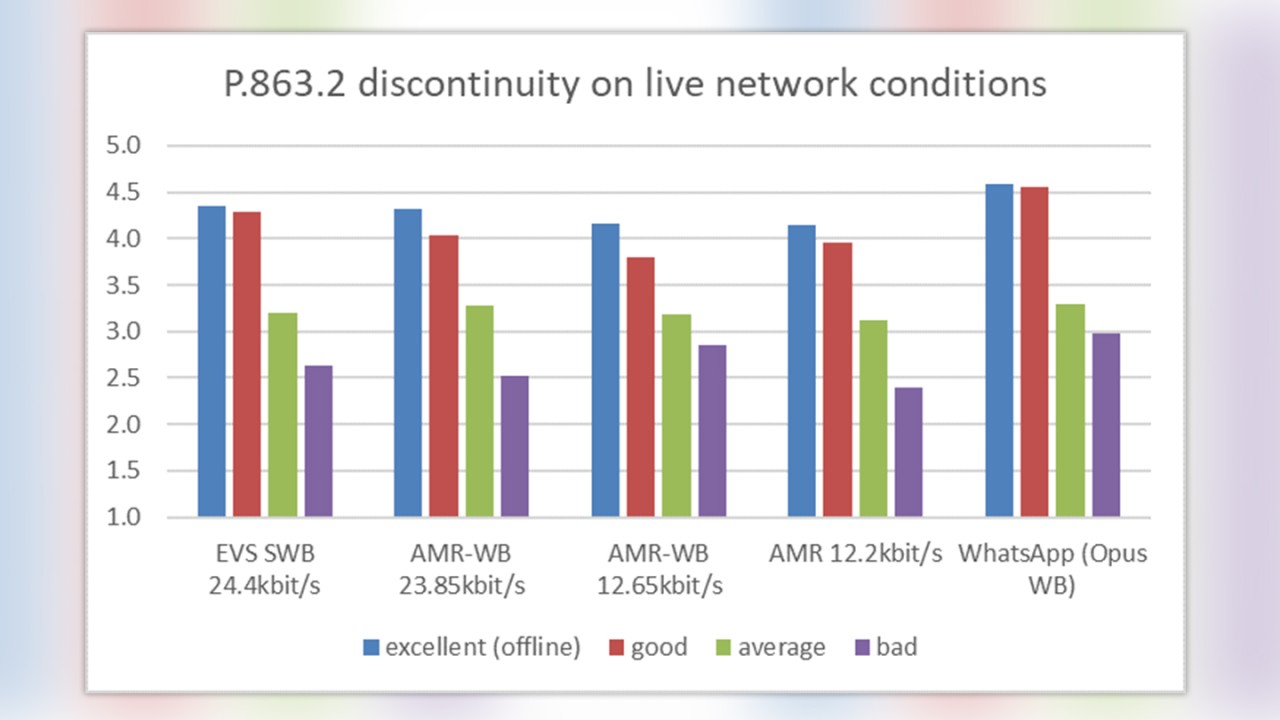
The figure below compares ITU-T P.863.2 discontinuity for different codecs and live network conditions. The offline encoded conditions represent an ideal situation with the best possible quality, no network impairments and no actual channel.
P.863.2 discontinuity decreases in the presence of network impairments, but remains at a similar level for different codecs and is widely independent from audio bandwidth. P.863.2 discontinuity can be used to compare transmission channel effects across different codecs, such as EVS and AMR-WB.
P.863.2 coloration
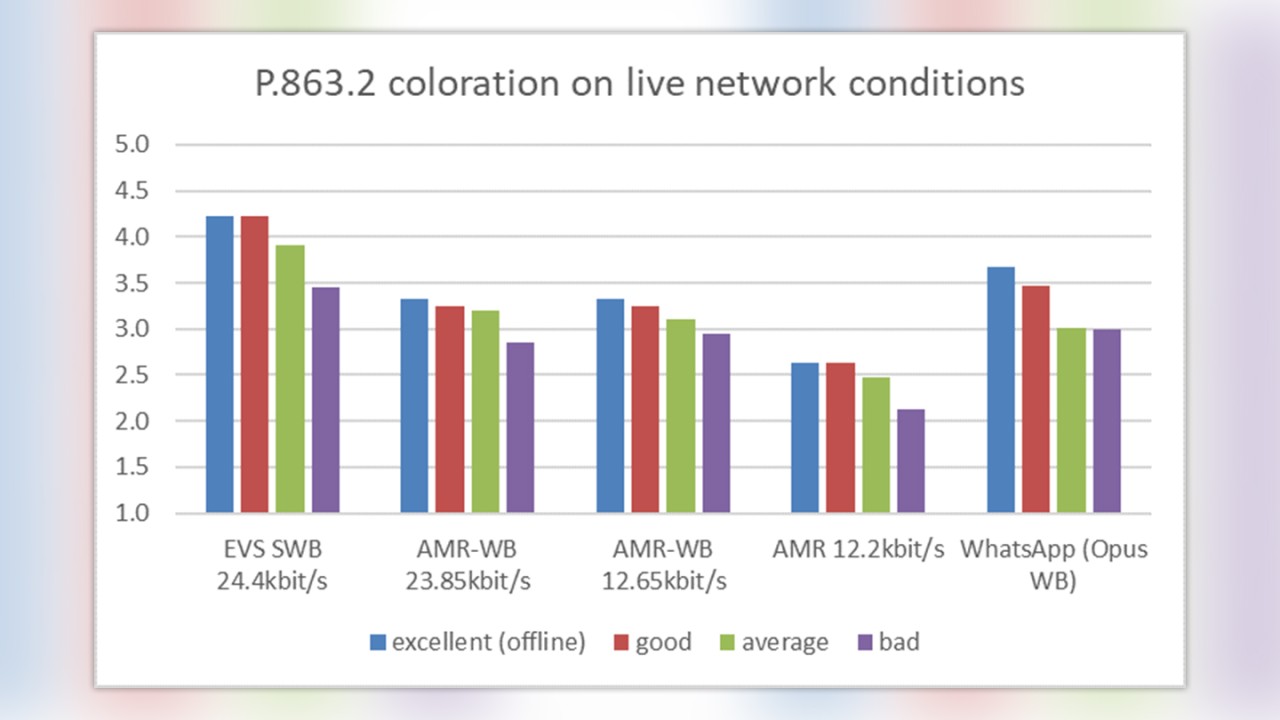
In mobile networks, P.863.2 coloration is mainly determined by the codec, which can reproduce speech signals up to narrowband, wideband or super-wideband. The presence of network filters and the terminal audio frequency characteristics also have an impact on P.863.2 coloration.
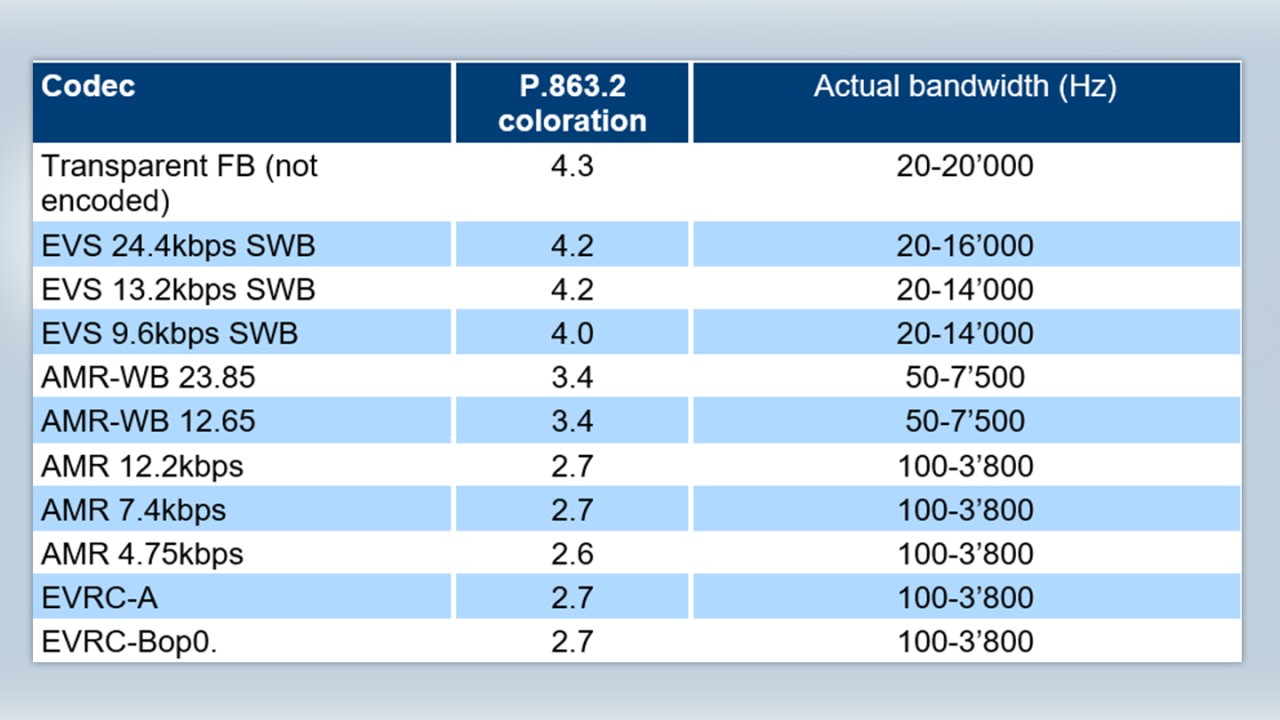
The following table shows typical P.863.2 coloration MOS values for perfect transmission under individual technology and codec conditions. The values are computed using the reference speech samples recommended in ITU-T P.501 Annex D.
P.863.2 coloration values are mainly determined by the codec audio bandwidth. As shown below, the impact of network impairments on P.863.2 coloration is very slight relative to P.863.2 discontinuity.
Conclusion
Additional diagnostic information has become available since ITU-T Rec. P.863 ‘POLQA’ was enhanced with the new P.863.2 standard. Automated mobile network testing will benefit from the newly specified discontinuity and coloration dimensions. Now it is possible to compare network conditions across different audio codecs. In addition, different telephony aspects such as fluidity of speech and audio bandwidth limitations can be analysed separately.
Rohde & Schwarz SwissQual AG co-invented ITU-T P.863 and was also a partner in the P.863.2 model development.
Results for the ITU-T P.863.2 quality dimensions are provided in all Rohde & Schwarz MNT products.


